Administration
Table of contents
- Grafana
- Teams (Enterprise feature)
- Users
- Profiles
- License
- Notifications channels (Enterprise feature)
- Jira (Enterprise feature)
Grafana
Perfana requires at least one Grafana instance to be present. One or more Grafana instances can be configured via the METEOR_SETTINGS environment variable:
"grafanaInstances": [
    {
      "label": "Demo",
      "clientUrl": "http://localhost:3000",
      "serverUrl": "http://grafana:3000",
      "orgId": "1",
      "username": "perfana",
      "password": "perfana",
      "snapshotInstance": true,
      "trendsInstance": true,

    }
  ],
- label: Descriptive name for this Grafana instance.
- clientUrl: The grafana url that your browser uses to connect to the Grafana instances.
- serverUrl: Optional Url to connect to Grafana instance from Perfana server side. For instance the service name when both Perfana and Grafana are running in Kubernetes.
- orgId: Grafana Organisation ID
- username: Username for Grafana admin user
- password
- snapshotInstance: If
truethis Grafana instance is used to store snapshots. - trendsInstance: If
truePerfana uses this instance for hosting Perfana dashboards for trends and profile check results.
As an admin user you can maintain the Grafana dashboards that have been synced with Perfana. Open the Grafana configuration from the Admin section of the sidebar.
The Grafana configuration view shows one or more Grafana instance tabs and for each instance the dashboards that have been registered in Perfana. To register a Grafana dashboard is Perfana is simple: just add a perfana tag to the dashboard:
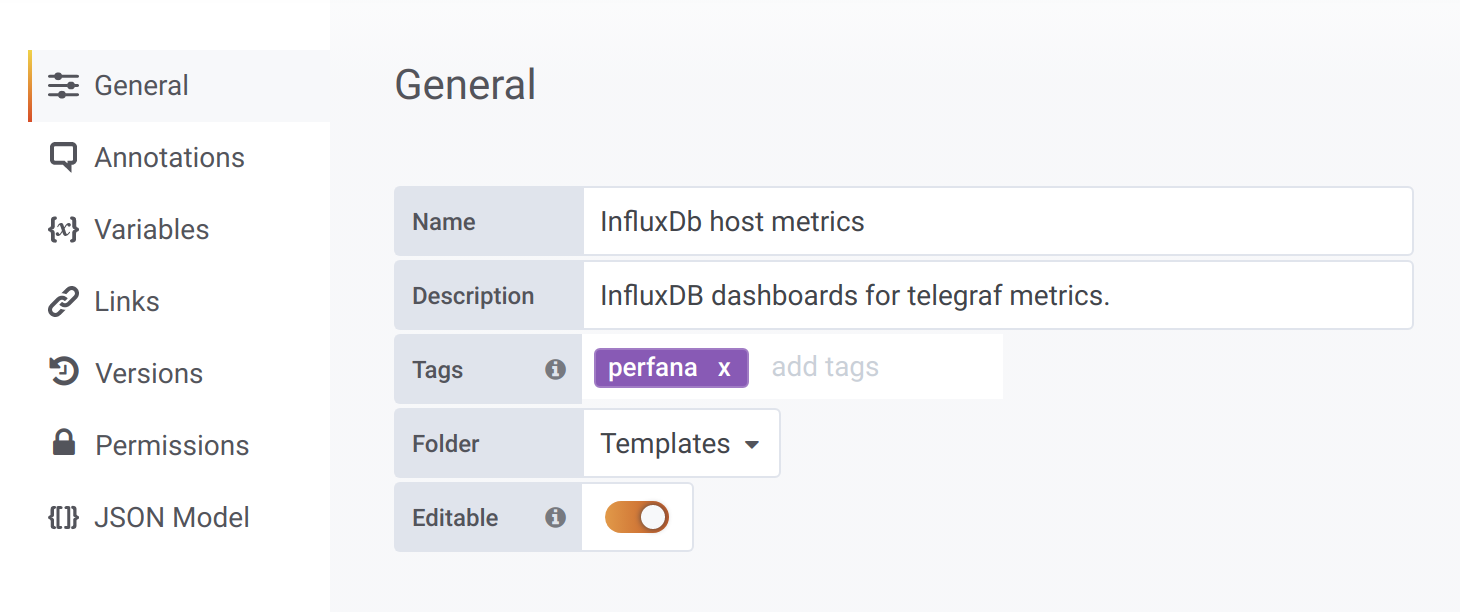
The grafana-perfana service will now automatically register the dashboard in Perfana and updates it when changes are made. Note: if the dashboard is deleted from Grafana by mistake, the grafana-perfana service will restore it.
Beware: if you use the
deleteicon in theLinked dashboardssection, the dashboard will be deleted in both Perfana and Grafana!
Teams (Enterprise feature)
Admin users can create Teams to efficiently organise the test run data in Perfana. Teams consist of one or more team members and a system under test is linked to one team.
To maintain the Teams admin users can open the Teams item from the Admin section of the sidebar.
Add a new Team by clicking the Add team button, this opens the Add team dialog:
- Organisation: Select Organisation.
- Name: The team name.
- Description: optional Add description for the team.
Click the team row to view the team members and the systems under test linked to this team.
A team has one or more team members and users can be member of one or more teams. To add team members click on the select box to select one or more users.
A team can be responsible for one or more systems under test, but a system under test is linked to one team only. To link system under tests to the selected team, select one or more via the select box.
When you link a
system under testto ateamthat was already linked to another team, it will no longer be linked to the other team!
Users
The users view lists all users known in Perfana. For each user it shows if they have the admin role and for what teams they have the team-member role. Admin users can assign roles to users or delete users.
Adding users can currently be done by:
- Using an external IDP via Keycloak
- By registering a new user via the login screen. To enable this set the following in the
METEOR-SETTINGSin thepublicsection:
  "public": {
    "forbidClientAccountCreation": false,
    ...
  },
New users will have a
viewerrole by default, allowing them to view all test results
Profiles
Perfana profiles can be used to automatically configure test runs. By passing tags via the (Gatling) script profiles can be activated for test runs.
<profile>
    <id>test-type-load</id>
    <activation>
        <activeByDefault>false</activeByDefault>
    </activation>
    <properties>
        <workload>loadTest</workload>
        <initialUsersPerSecond>1</initialUsersPerSecond>
        <targetUsersPerSecond>2</targetUsersPerSecond>
        <rampupTimeInSeconds>30</rampupTimeInSeconds>
        <constantLoadTimeInSeconds>240</constantLoadTimeInSeconds>
        <perfanaEnabled>true</perfanaEnabled>
        <testRunId>${systemUnderTest}-${version}-${workload}-${testEnvironment}-${build.timestamp}</testRunId>
        <eventsEnabled>true</eventsEnabled>
        <tags>gatling,micro-service</tags>
    </properties>
</profile>
The following can automatically be added via profiles:
Grafana dashboards
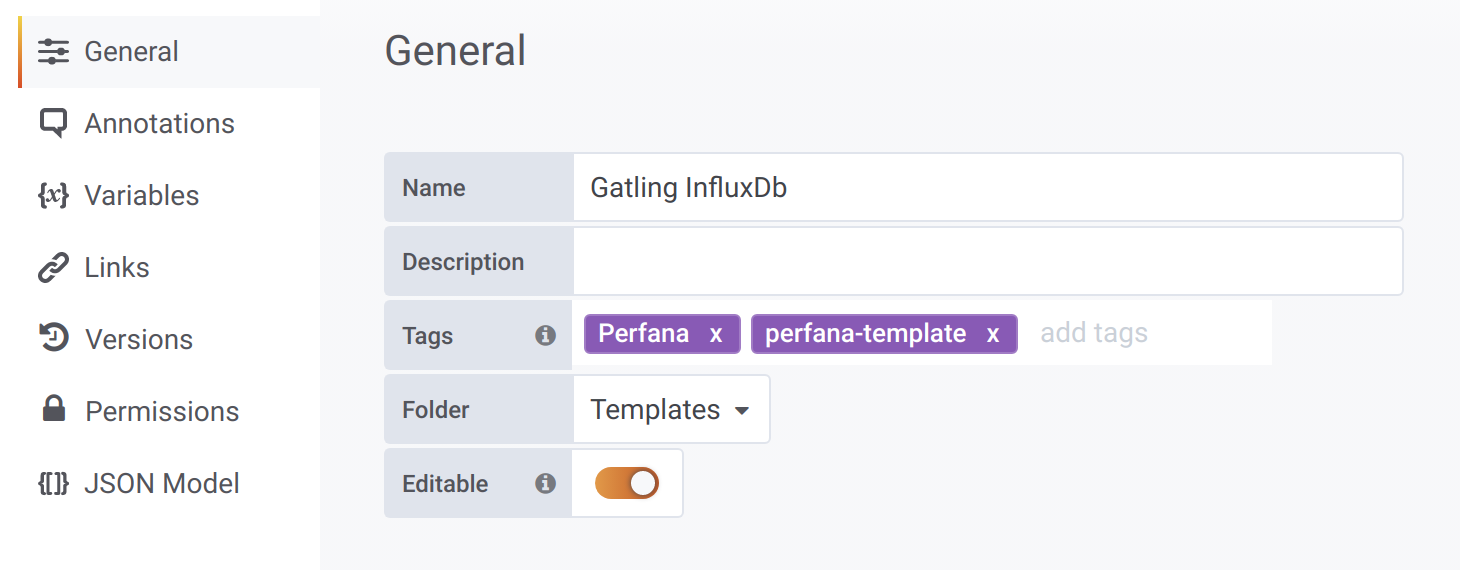
Profiles can be used to automatically link Grafana dashboards to test runs. To use a Grafana dashboard for auto-configuration it has to be tagged in Grafana as perfana-template
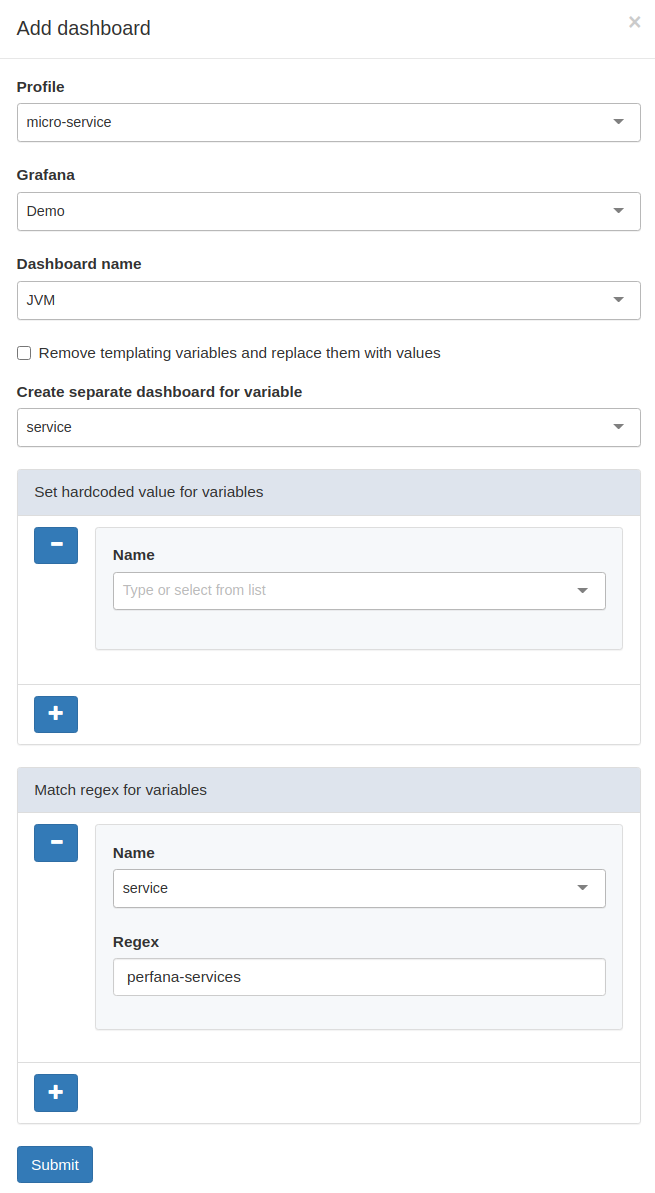
To add a template dashboard to a profile, select a profile and click on Add dashboard to open the form with these fields:
- Profile: The selected profile.
- Grafana: Select the Grafana instance that hosts the template dashboard.
- Dashboard name: Select the template dashboard.
- Remove templating variables and replace them with values: if checked, templating variables in the created instance of the template dashboard will be replaced by hardcoded values. This is useful if you want to integrate Grafana alerts with Perfana. Unfortunately Grafana alerts cannot be created on templated dashboards.
- Create separate dashboard for variable: optional if a templating variable is selected, a separate Grafana dashboard will be created for each distinct value that is found for that templating variable.
- Set hardcoded value for variables: optional use this to set hardcoded values for the available templating variables
- Match regex for variables: optional use this to only add the dashboard when a value for the selected templating value matches the provided regular expression.
The easiest way to use this feature is to label metric data with tags
system_under_testandtest_environmentand in your template Grafana dashboard use these properties as templating variables. Perfana will automatically match these to the test run properties. If for some reason this is not possible, use theMatch regex for variablesto determine what metrics to add to your test.
You can use dynamic variables passed by the load test script variables. The variable name should have the format perfana-.* e.g.
 <variables>
    <perfana-services>^optimus-prime-.*</perfana-services>
 </variables>
Service Level Indicators (Enterprise feature)
For the any of the Grafana dashboards added to the profile it is possible to automatically add Service Level Indicators to test runs that are tagged with the profile name.
This feature can be used to set enterprise-wide Service Level Objectives for specific metrics. The check results are recorded and the results can be viewed over time aggregated by
teamandsystem under test
To add a service level indicator to a profile click Add metric. Learn here how to add a service level indicator.
Reporting panel
A profile can also be used to specify a reporting template for test runs with matching tags.
This feature can be used to create a enterprise-wide uniform reporting standard, for instance for formal release tests reports.
To add a report panel to the reporting template fo a profile click Add panel. Learn here how to add a report panel.
Links
A profile can be used to automatically add links for test runs with matching tags.
License
In the license view you can add and view your license. There are two ways to add a license:
- Add license key: add your license key (requires Perfana to connect to the internet)
- Add offline license key: add offline license key when no internet connection is available
Notifications channels (Enterprise feature)
Perfana can use Slack, Teams or Google Chat channels to notify your team of specified events.
Admin notification channel
As an admin user, you can setup notification channels that are not linked to a system under test. A typical use case for this would be a “performance engineering support channel” that can be included in comments by users to ask the community for help. To set up a such a channel, click on the Admin notifications channel item in the Admin section in the sidebar.
This will open the Add notification channel dialog with the following fields:
- Channel type: Select
Slack,TeamsorGoogle Chat - Channel name: Provide channel name
- Webhook url: Provide Webhook url
- Include user mentions Select additional (admin) users,that will trigger a notification when mentioned.
Jira (Enterprise feature)
Perfana can integrate with one or more Jira instances to create issues and link them to test run results. The Jira configuration view can be used to setup the integration.
Setting up an AppLink
To use Jira from Perfana an AppLink is used. Perfana has a wizard that will guide you through the process. You will require a Jira user that has sufficient rights to set up AppLinks.
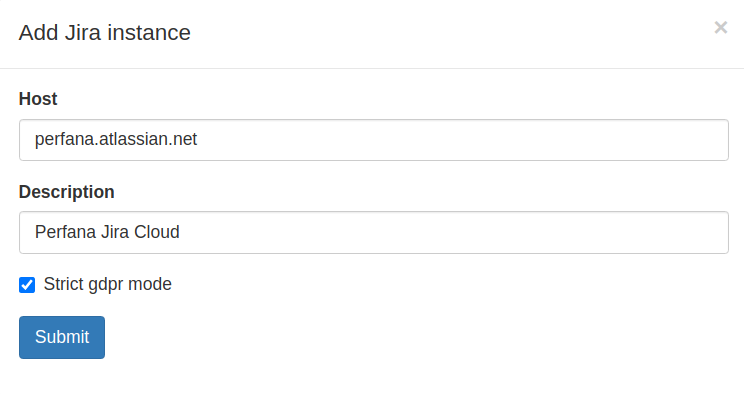
The first step is to click Add Jira instance, provide a host and description and determine if GDPR strict mode is enabled on the instance.
The next step is to click the configure link in the Oauth configured column. Follow the wizard steps and finish by adding the Jira oauth configuration to the METEOR-SETTINGS and restarting Perfana.
Allowed issue types and priorities
By default Perfana will show all issue types and priorities available for the selected Jira project. To limit the available issue types and priorities in the Perfana dialog, add the allowed issue types and priorities explicitly in the configuration section.
Beware: adding options that do not exist for a specific project can result in empty option lists in the
Add Jira issuedialog!
Issue reporters
If the user that logs into Perfana does not exist in Jira, it is not possible to create Jira issues. In the Jira reporters section one or more “fallback users” can be added to act as reporter in Jira issues. These “fallback users” must of course exist in the Jira instance!