Test settings
Table of contents
- Available settings
- System under test settings
- Notifications channels (Enterprise feature)
- Grafana dashboards
- Service Level Indicators
- Reporting template
- Abort alert tags
- Links
Available settings
The Settings section in the side bar is only present when a user has the team-member role for a team that is responsible for a system under test.
In Perfana, different configurations can be defined for a specific combination of test run properties. These properties are available in the Test run selector filter: System under test, Test environment and Workload.
For selected System under test:
- the
System under testsettings - the
Notifications channelssettings (Enterprise feature)
For selected System under test and Test environment:
- the
Grafana dashboardssettings
For selected System under test, Test environment and Workload:
- the
Service Level Indicatorssettings - the
Reporting templatesettings - the
Abort alert tagssettings - the
Linkssettings
When no selection is made for one of the properties in the filter, the settings are greyed out.
Please refer to profiles to automatically configure the test run settings.
System under test settings
Click the System under tests menu item under the Settings section in the side bar.
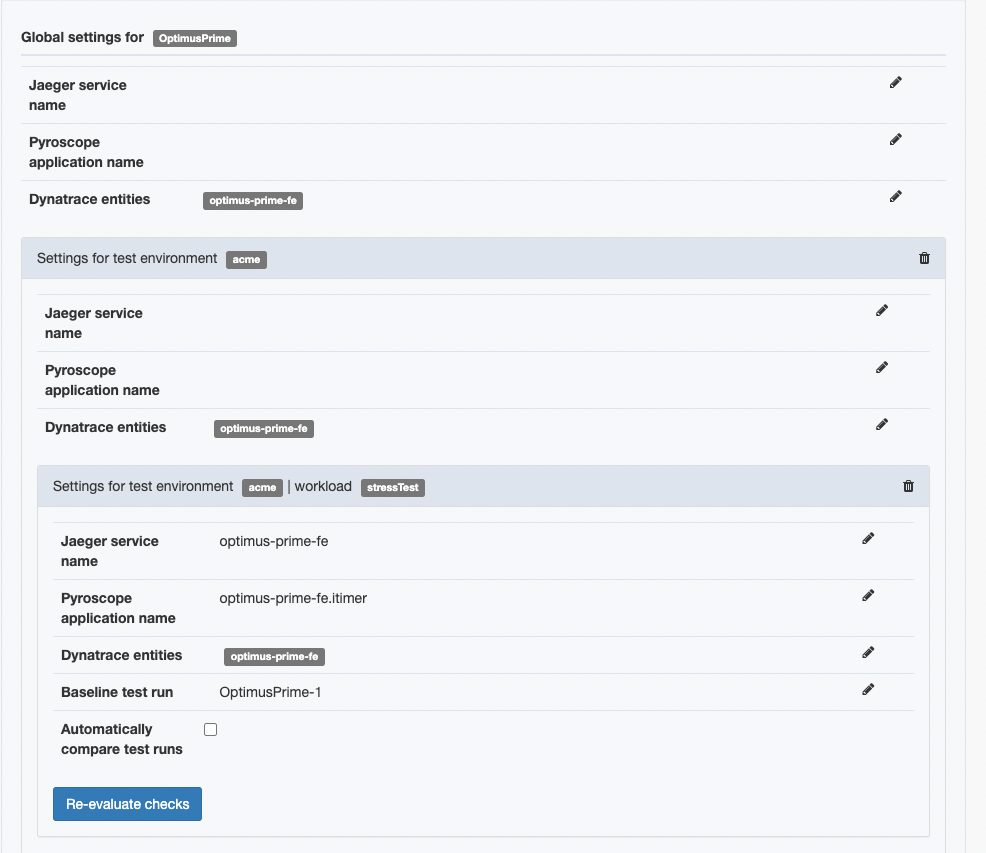
The following properties can be configured:
- Jaeger service name: if a Jaeger integration is available, the service name to use as entrypoint can be set here
- Pyroscope application name: if a Pyroscope integration is available, the application name as used in Pyroscope can be set here
- Dynatrace entities: if a Dynatrace integration (Enterprise feature) is available, one or more Dynatrace entities can be linked to the system under test
- Baseline test run id: for each
test environment-workloadcombination set a baseline test that is used in the automated analysis of test runs.
The Jaeger, Pyroscope and Dynatrace properties can be set on global level, test environment level or workload level. Values specified on workload level override those on test environment level and values specified on test environment level override global values.
On the workload level you can enable / disable Perfana to automatically compare test runs if any Service Level Indicators have been configured with compare thresholds The default for this setting be be set through the settings
With the Re-evaluate checks button you can trigger all test runs for the specific workload to be re-evaluate. Beware that this could take some time if there is a large number of test runs.

Notifications channels (Enterprise feature)
Perfana uses Slack, Teams or Google Chat channels to notify your team of specific events.
To set up a notification channel for your sytem under test click on the Notifications channels item in the Settings section of the side bar.
This opens the Add notification channel dialog with the following fields:
- System under test
- Channel type: Select
Slack,TeamsorGoogle Chat. - Channel name: The name of the channel, e.g. #support.
- Web hook url: The Web hook url for the chosen channel type.
- Send notification when a test run has finished Check to send a notification when a test runs has finished.
- Send notification for failed test runs only Check to send a notification only when a test run has failed.
- Send notification to this channel if any of the team members are mentioned in comments Checked to send a notification when any of your team members is mentioned in a comment.
- Include user mentions Trigger a notification when selected users are mentioned.
- Use as team notifications channel (for all systems under test for this team): If checked this notification channel is used for all
systems under test’s that are linked to thisteam
Grafana dashboards
Any Grafana dashboard that is registered in Perfana can be linked to a test run. Select both a system under test and an test environment in the Test run selector to enable the Grafana dashboards setting in the sidebar. Click the Add dashboard button to bring up the Add Grafana dashboard dialog.
This dialog has the following fields:
- Grafana: Select a Grafana instance.
- Dashboard name: Select a Grafana dashboard.
- Dashboard label: Add descriptive label, e.g. “Host metrics webserver 1”.
- Variables: If the Grafana dashboard has templating variables, select variables and set one or more values.
- Time for taking snapshots (s): The number of seconds to take a snapshot. You may need to configure the timeout value if it takes a long time to collect your dashboard’s metrics.
Service Level Indicators
When one or more Grafana dashboards are linked to the test runs, you can select metrics from these dashboards as Service Level Indicators.
Service Level Indicatorsworks onWorkloadlevel, so the sidebar item is only active when you select aSystem under test,Test environmentandWorkloadin theTest run selector.
There is an option to automatically assess Service Level Indicators after a test run finishes. The results can be used as a quality gate when running tests from a CI/CD pipeline.
Two types of checks exist for a Service Level Indicator:
- Service Level Objective: Check if the
Service Level Indicatorsvalue isgreater thanorsmaller thana specified value. An example check is “Average CPU usage should be smaller than 70%” or “Maximum throughput should be higher than 1000 (rps)” - Comparison: Check if the
deltabetween test runs is within allowed thresholds. Example: “Allow a positve deviation of 20% between test runs for the 99th percentile response times”
Add Service Level Indicator
Click the Add metric button to add a Service Level Indicator. This opens the Add Service Level Indicator form.
The form has the following fields:
- Grafana: Select a Grafana instance.
- Dashboard label: Select a Grafana dashboard to select metric from.
- Panel: Select Grafana panel. Currently only graph panels and table panels can be used as
Service Level Indicator. - Exclude ramp up time when evaluating test run: Check to exclude the
rampUpTimefrom evaluation data. For instance, include rampUpTime data for a stress test which only does a ramp up for the whole test. - Average all panel series when comparing test runs: Check to average all series produced by the panel before evaluating the data.
- Evaluate: Select the aggregation to use on the data in the evaluation:
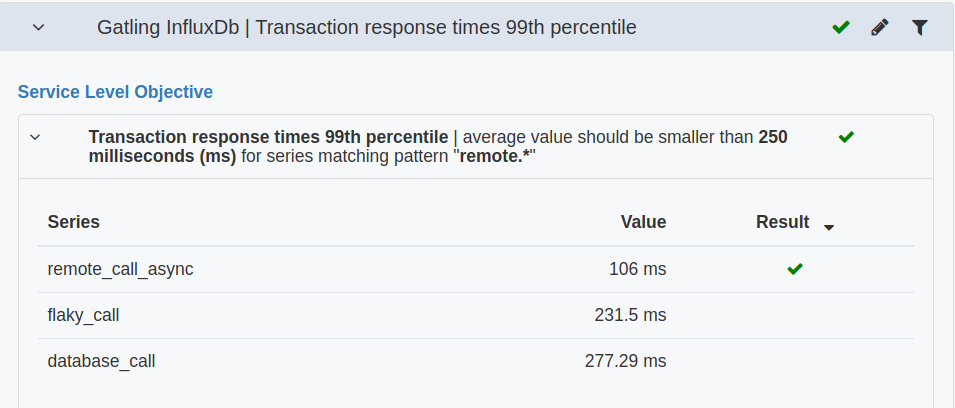
Average(default),Maximum,MinimumorLast. - Only apply to metrics matching regex pattern: a panel can have multiple series. Optionally specify a regular expression to filter the series that the checks apply to, e.g.
remote.*as shown in the screen shot below.

- Service Level Objective: Choose the
Service Level Objectiveto check. - Comparison: Specify the allowed deviation between test runs. Give a positive or negative allowed deviation. And choose an absolute or percentage deviation. For a percentage deviation a
Fail only if absolute deviation exceedsfield appears. Here you can say that eventhough a percentage change is not allowed, it should still exceed this absolute value. For example, if you allow 10% deviation, and the response times change from 40 to 45 milliseconds, the increase percentage is 12.5%. But if you consider 5 milliseconds as an acceptable change (it’s still a small increase to notice), you can specify that the absolute change should be more that 10 milliseconds for the check to fail. - Update existing test runs: Check to (re)evaluate all existing test runs with matching
System under test,Test environmentandWorkloadproperties.
Edit Service Level Indicator
Click the pencil icon in the row to edit a Service Level Indicator.
Service Level Indicators that are generated via Perfana profiles cannot be edited or removed by non-admin users. These Service Level Indicators show the originating profile in the profile column of the table. For non-admin users the only editable field is the Only apply to metrics matching regex pattern.
Regular expression helper
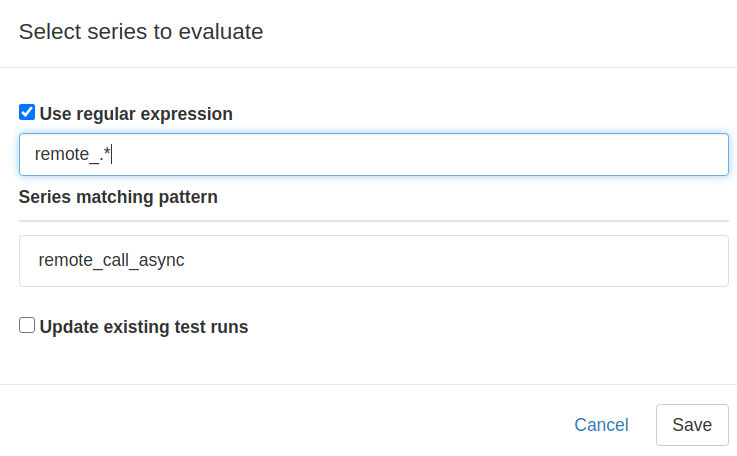
To help create regular expressions, click the filter icon in the end the row in the Service Level Indicators and Check results views. The Filter request helper dialog lets you create regular expressions for the Only apply to metrics matching regex pattern field of Service Level Indicators. If check result data is available, the Filter request helper lets you preview the results of a regular expression in Series matching pattern, as shown below.

Reporting template
The
Reporting templateworks onWorkloadlevel, so the sidebar item is only active when you select aSystem under test,Test environmentandWorkloadin theTest run selector.
Perfana produces test run reports that can be shared with stakeholders. Reports consist of a selection of relevant graphs with descriptions as defined in report templates. Reports are automatically generated from these templates.
Click the Add panel button to add a panel to the report template. This opens the Add report panel form, with the following fields:
- Grafana: Select a Grafana instance.
- Dashboard label: Select a dashboard that contains target panel.
- Panel: Select a panel.
- Annotation: Add a default annotation to be displayed next to the graph.
Abort alert tags
The
Abort alert tagsworks onWorkloadlevel, so the sidebar item is only active when you select aSystem under test,Test environmentandWorkloadin theTest run selector.
Perfana can automatically abort a test run based on specific tags of alerts received during the test.
Click Add alert tag to add an Abort alert tag. The Add abort alert tag form has the following fields:
- Alert source: Select the alert source: AlertManager, Kapacitor or Grafana.
- Tag key: The tag key that you want to trigger a test run abort. Example:
maximum_response_time_abort. - Tag value: The tag value you want to trigger a test run abort. Example:
true
Links
Linksworks onWorkloadlevel, so the sidebar item is only active when you select aSystem under test,Test environmentandWorkloadin theTest run selector.
With the Links feature you can create deep links from your test run results to any relevant url. In the url you can use a number of predefined Perfana variables, like:
- perfana-system-under-test
- perfana-test-environment
- perfana-workload
- perfana-test-run-id
- perfana-previous-test-run-id
- perfana-baseline-test-run-id
- perfana-build-result-url
- perfana-start-epoch-milliseconds
- perfana-start-epoch-seconds
- perfana-end-epoch-milliseconds
- perfana-end-epoch-seconds
- perfana-start-elasticsearch
- perfana-end-elasticsearch
You can also use any key available in the test run configuration items as a variable in your url.
The dynamic variables in the link are surrounded by curly braces, for example: https://externa.url/interesting/data/{perfana-system-under-test}
To add a link click Add link, this will open the Add link form with the following fields:
- Name: Name for the link, this will be displayed in the
test run summaryview. - Url: Url for the link. To add one of the available variables to the url, type the “{“ (open curly brace) character, this will display a dropdown menu of all the available variables. Type to filter the available items.