Integrations
Table of contents
- event-scheduler-maven-plugin
- events-gatling-maven-plugin
- events-jmeter-maven-plugin
- test-events-loadrunner-cloud
- test-events-command-runner
- test-events-springboot
- test-events-test-run-config-command
- test-events-wiremock
- perfana-java-client
- Jaeger
- Pyroscope
- Slack (Enterprise feature)
- Teams (Enterprise feature)
- Google Chat (Enterprise feature)
- Jira (Enterprise feature)
- Dynatrace (Enterprise feature)
event-scheduler-maven-plugin
A plain event-scheduler to generate events during a load test
events-gatling-maven-plugin
Integrate Gatling load test with Perfana, triggered via Maven with event-scheduler build-in
events-jmeter-maven-plugin
Integrate Jmeter load test with Perfana, triggered via Maven with event-scheduler build-in
test-events-loadrunner-cloud
Integrate LoadRunner Cloud load test with Perfana, triggered via Maven with event-scheduler build-in
test-events-command-runner
Maven plugin to run a command at certain events
test-events-springboot
Fetch configuration information from SpringBoot apps via actuator and send it to Perfana
test-events-test-run-config-command
Fetch configuration information using a shell command and send it to Perfana
test-events-wiremock
Events to load and change wiremock stubs during load tests.
perfana-java-client
Java library to integrate with Perfana
Jaeger
Perfana can be integrated with Jaeger to enable deeplinking from test results into the Jaeger UI to view application traces. To enable this integration, a number things have to be set up:
Add headers to (Gatling) script
In order to be able to filter traces in the Jaeger UI based on test run id and request names in your (Gatling) script, two headers have to be added to each request in your script, that will passed by Spring as “baggage” with the traces:
perfana-test-run-idperfana-request-name
In Gatling you can the perfana-test-run-id header at HttpProtocol level by adding a line to the HttpProtocolBuilder
 val httpProtocol: HttpProtocolBuilder = {
    val protocol = http
      .baseUrl(ApplicationConfiguration.host)
      .inferHtmlResources()
      .acceptHeader("*/*")
      .acceptEncodingHeader("gzip, deflate, sdch")
      .acceptLanguageHeader("en-US,en;q=0.8")
      .contentTypeHeader("application/json")
      .userAgentHeader("Mozilla/5.0 (Macintosh; Intel Mac OS X 10_11_2) AppleWebKit/537.36 (KHTML, like Gecko) Chrome/54.0.2840.98 Safari/537.36")
      .shareConnections
      .header("perfana-test-run-id",System.getProperty("testRunId"))
The perfana-request-name header has to be added to each request separately, e.g.
 val call = exec(http("remote_call_delayed")
    .get("/remote/call?path=delay")
    .header("perfana-request-name", "remote_call_delayed")
    )
Note: when using a Gatling script, if your request names contains spaces, replace those with underscores in the
perfana-request-nameheader value.
Configure baggage
In the Perfana demo setup Spring Cloud Sleuth is used to create traces and send them to the Jaeger collector in the Zipkin format. To pass the headers added in the script to Jaeger, the headers have to configured as baggage:
"spring.sleuth.keys.http.headers": "perfana-test-run-id,perfana-request-name"
"spring.sleuth.propagation.tag.enabled": "true"
"spring.sleuth.propagation.tag.whitelisted-keys": "perfana-test-run-id,perfana-request-name"
"spring.sleuth.propagation-keys": "perfana-test-run-id,perfana-request-name"
"spring.sleuth.baggage-keys": "perfana-test-run-id,perfana-request-name"
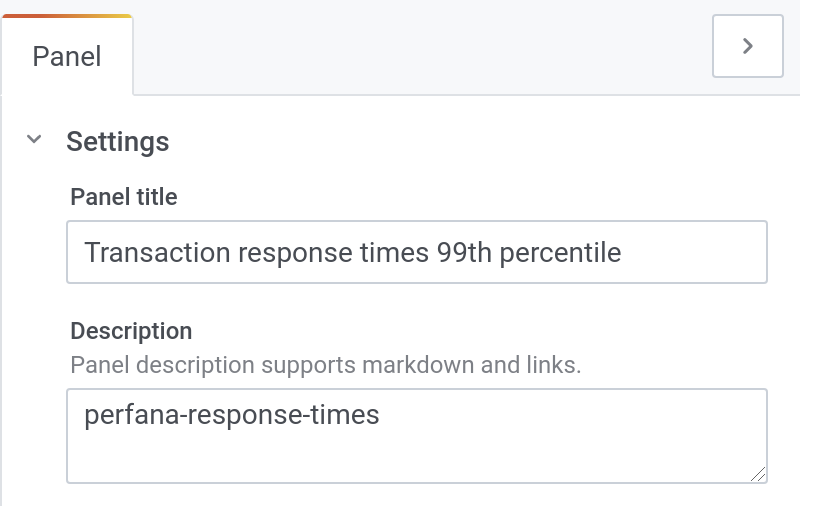
Tag metrics
Perfana creates an Only show traces that fail to meet Service Level Objective filter when it finds a Service Level Objective specified based a Grafana panel that has perfana-response-times in the description, in a dashboard that is tagged with perfana-performance-test-tool.
Pyroscope
Perfana can integrate with Pyroscope to do continuous profiling on your system under test. Read here how to install Pyroscope. See settings section how to configure Pyroscope integration in Perfana.
Slack (Enterprise feature)
To configure your Slack channel as a Perfana notification channel, create a Incoming Webhook for your channel using these instructions. Use the Webhook URL when setting up your notifications channel
Teams (Enterprise feature)
To configure your Teams channel as a Perfana notification channel, create a Incoming Webhook for your channel using these instructions. Use the Webhook URL when setting up your notifications channel
Google Chat (Enterprise feature)
To configure your Google Chats Room as a Perfana notification channel, create a Incoming Webhook for your room using these instructions. Use the Webhook URL when setting up your notifications channel
Jira (Enterprise feature)
Perfana can integrate with one or more Jira instances to create issues and link them to test run results. The Jira configuration view can be used to setup the integration.
Dynatrace (Enterprise feature)
Perfana can be integrated with Dynatrace to include tracing information in your test run results. To enable this integration, take the following steps:
Create Dynatrace API token
In Dynatrace, go to Settings -> Integration -> Dynatrace API and click Generate Token. Name the token perfana and add the the following scopes:
API v1:
- Access problem and event feed, metrics, and topology
- Read Configuration
API v2:
- Read entities
- Read problems
- Read settings
Copy the generated API token. Next, click the Dynatrace API explorer link and copy the host from the url from the adress bar.
Add API token and host to the METEOR-SETTINGS and restart Perfana:
  "dynatraceApiToken": "<Dynatrace API token>",
  "dynatraceUrl": "https://somehost.live.dynatrace.com",
Add headers to (Gatling) script
To filter traces in Dynatrace based on test run id and request names in your (Gatling) script, add two headers to each request in your script
perfana-test-run-idperfana-request-name
In Gatling you can add the perfana-test-run-id header at HttpProtocol level by adding a line to the HttpProtocolBuilder
 val httpProtocol: HttpProtocolBuilder = {
    val protocol = http
      .baseUrl(ApplicationConfiguration.host)
      .inferHtmlResources()
      .acceptHeader("*/*")
      .acceptEncodingHeader("gzip, deflate, sdch")
      .acceptLanguageHeader("en-US,en;q=0.8")
      .contentTypeHeader("application/json")
      .userAgentHeader("Mozilla/5.0 (Macintosh; Intel Mac OS X 10_11_2) AppleWebKit/537.36 (KHTML, like Gecko) Chrome/54.0.2840.98 Safari/537.36")
      .shareConnections
      .header("perfana-test-run-id",System.getProperty("testRunId"))
The perfana-request-name header has to be added to each request separately, e.g.
 val call = exec(http("remote_call_delayed")
    .get("/remote/call?path=delay")
    .header("perfana-request-name", "remote_call_delayed")
    )
Note: when using a Gatling script, if your request names contains spaces, replace those with underscores in the
perfana-request-nameheader value.
Adding request attributes
In Dynatrace request attributes have to be set up to parse the Perfana headers from the incoming requests. Go to Settings -> Server-side service monitoring -> Request attributes and click Define a new request attribute
- Add
perfana-test-run-idasRequest attribute name - Click on
Add new data source - In the
Request attribute sourcedropdown, selectHTTP request header - Add
perfana-test-run-idasParameter nameand clickSave - Click
Savein the top right to save therequest attribute
Repeat the same steps for perfana-request-name