Perfana demo
Table of contents
- Demo environment
- Prerequisites
- Getting started
- Exploring the demo environment
- Start a test
- View test runs in Perfana
- Alerts
Demo environment
The Perfana demo environment can be used to try out all the features. It uses Docker compose and has a all components to emulate a live-like environment for Perfana, including an application to run a performance test.
Prerequisites
- Docker
- Docker compose
- A minimum 8Gb of RAM allocated to docker daemon, preferably more
Getting started
- Clone perfana-demo repository
git clone https://github.com/perfana/perfana-demo.gitor download here
If you use the download option, make sure to extract the zip to a directory named
perfana-demo! - Add this to your hosts file
127.0.1.1 perfana 127.0.1.1 jenkins 127.0.1.1 grafana - Inside the repository root run
./start.sh
This spins up a number of containers
| Container | Description | exposed to local port |
|---|---|---|
| perfana | Perfana front end | 4000 |
| perfana-grafana | Perfana - Grafana integration service | n/a |
| perfana-snapshot | Perfana snapshot service | n/a |
| perfana-check | Perfana results check service | n/a |
| perfana-fixture | Loads fixture data | n/a |
| perfana-jenkins | Jenkins with two performance test jobs pre-configured | 8080 |
| mongodb | MongoDb replicaset to store Perfana configuration | 27011 / 27012 /27013 |
| grafana | Grafana graphing dashboard | 3000 |
| influxdb | InfluxDb metrics datastore | 8086 / 2003 |
| telegraf | Telegraf metrics agent | n/a |
| prometheus | Prometheus metrics datastore | 9090 |
| alertmanager | Alertmanager handles alerts from Prometheus | 9093 |
| optimus-prime-fe | Springboot test application | 8090 |
| optimus-prime-be | Springboot test application | n/a |
| mariadb | Database used by test application | n/a |
| jaeger | Distributed tracing | 16686 |
| omnidb | Online database management tool | 8888 |
| logstash | Logstash for parsing logs | n/a |
| elasticsearch | Logs storage / serarch engine | n/a |
| kibana | Kibana Elasticsearch UI | 5601 |
| wiremock | Mocking tool | 8060 |
To stop all containers, run
./stop.sh
To remove all containers, use
./clean.sh
When you use the
clean.shscript, all of the data inside the containers will be lost!
To start, stop or remove containers individually use docker-compose and the service name as used in the docker-compose.yml file, e.g. when a newer version of the perfana image is available
docker-compose stop perfana && docker-compose rm -f perfana && docker-compose up -d perfana
The
perfana-demorepository is updated frequently, so to get the latest and greatest pull repo and images.
git pull && docker-compose pull
Exploring the demo environment
Perfana
To log into Perfana, open http://localhost:4000 and use admin@perfana.io as user with password perfana. If you want to log in as a non-admin user, you can try users daniel@perfana.io or dylan@perfana.io, both with password perfana
Jenkins
To log into Jenkins, open http://localhost:8080 and use perfana as user with password perfana
Grafana
To log into Grafana, open http://localhost:3000 and use perfana as user with password perfana
Start a test
The Perfana demo environment comes with a Jenkins instance preconfigured with a job that will trigger a Gatling script to execute a load test on two instances of Afterburner, a Spring Boot test application, deployed as optimus-prime-fe and optimus-prime-be. The job checks out the perfana-gatling-afterburner repository and triggers the test via the events-gatling-maven-plugin. When the job is started, this plugin sends meta data for the test, as specified in the pom.xml, to Perfana.
To start a test, go to http://localhost:8080, click on the OptimusPrime job and click Build with parameters. The following parameters can be set:
- system_under_test: Use this parameter to set the System Under Test property in Perfana. Default is set to
OptimusPrime - gatlingRepo: Repository containing the Gatling script. By default the job is using https://github.com/perfana/perfana-gatling-afterburner/tree/OptimusPrime
- workload: Workload to use in the test, corresponds to the workload profiles in the pom.xml
- annotation: Can be used to add some annotation to the test run.
The demo contains three workload examples to demonstrate some use cases for Perfana:
- load test: a steady state load on OptimusPrime. Run this workload a few times to view the automatic analysis feature in action, that can be used as quality gate in a CI/CD setup.
- stress test: an increasing load on OptimusPrime, until the test is automatically terminated when the system under test reaches a specified condition. Demonstrates the use of abort alert tags
- slow back end test: a steady state load on OptimusPrime. A wiremock stub is configured to emulate a back end service for OptimusPrime. The test-events-wiremock plugin is used to increase the response times of the stub during the test. This test can be used to test the resilience of a system under test.
When the job has started, open the console log to see the events-gatling-maven-plugin is building and executing the test.
Note: when the job is running for the first time it will take some time to start up because Maven has to download all dependencies. Check the build log via
Console Outputto see the progress.
View test runs in Perfana
To have a look at the test results in Perfana open http://localhost:4000 and use admin@perfana.io as user with password perfana to log in.
In the home page click on Afterburner under Your systems under test. In the Running tests section you will see the test you have just triggered.
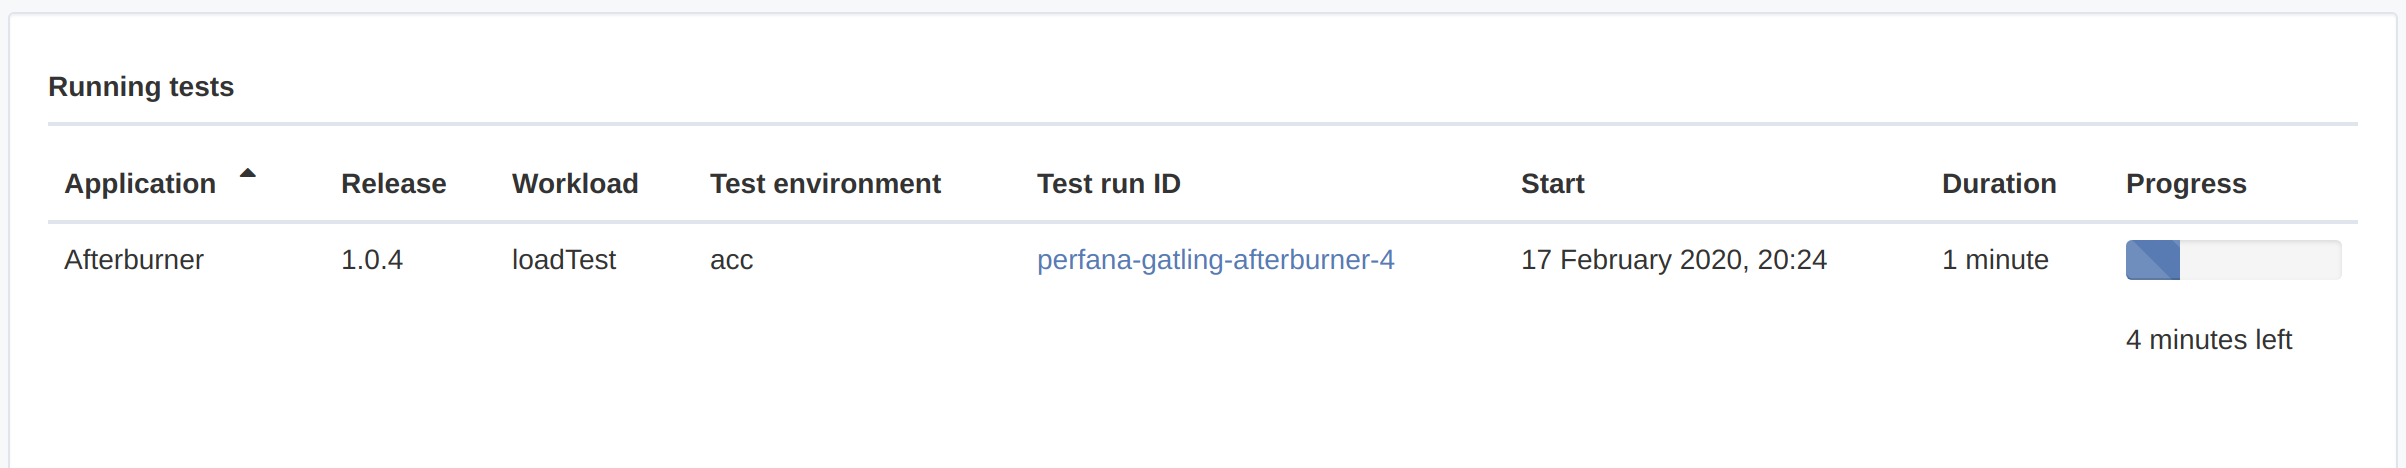
Click here to learn more about the Running tests section.
When the test has finished the test run is displayed in the Recent runs section and a number of events are triggered:
- Perfana creates snapshots for all of the Grafana dashboards linked to the test run.
- Perfana evaluates all Service Level Objectives (read here how to configure) and compares thresholds for the Service Level Indicators of the test run. After the evaluation the consolidated results are displayed in the
Resultscolumn.
Click here to learn more about the Recent runs section.
If more than one test run is available for a specific set of test run properties, a Trends tab becomes visible. In this tab you can view trends over time for the specified Service Level Indicators. Read more on trends
View test run details
To view more details for the test run you can click on the test run ID. The test run details view has a number of tabs:
Alerts
In the demo environment three Alertmanager alerts are defined, as you can see in the Prometheus UI.
These alert rules can be found in the prometheus.rules.yml file in the perfana-demo repo
In alertmanager.yml Perfana has been set up as receiver
The Afterburner test application has been set up to expose JVM metrics via actuator and two metric tags have been added system_under_test and test_environment.
If one of the alerts is triggered, Perfana tries to map alert metric tags to properties of any running test. If it finds a match, it will create an annotation for all linked Grafana dashboards in each graph. This can help you track down root causes for bottleneck in your test runs.
Learn more on alerts here