Quick start
Table of contents
High over Perfana concepts
Quick introduction of Perfana concepts for first time users.
Let us go over the concepts, how they relate and how they are connected on a - high over - technical level.
First, we have the system under test, which is a deployable piece of software that can be tested.
The load script sends requests to the system under test, as if it is used by many users at the same time.
Metrics from both the load script and the system under test are sent to Perfana Cloud. The metrics we use to analyse the result of the test.
Metrics are queried and displayed in dashboards. Each dashboard contains one or more panels for distinguished metrics.
We want to run many tests to see how the behaviour of the SUT changes over time: is it getting faster or is it getting slower and is action needed to make it faster. One test is called a test run. Each run has a unique test run id.
Checks are used to verify the performance requirements. A Service Level Indicator (SLI) defines what to measure, while the Service Level Objective (SLO) sets the objective for the specific metric. For each test run Perfana automatically checks is the objective is achieved.
Tying it all together
By now you probably ask yourself how Perfana ties this all together. How are load scripts, SUT’s, dashboards and checks automatically linked to each other? Keywords to this answer are tags, (“Golden Path”) profiles and auto configuration.
Profiles define a set of dashboards, SLI/SLO’s and more. Perfana contains several Golden Path profiles that come out of the box for common stacks and apply best practices.
A test run has tags. For instance: gatling, spring-boot, kubernetes. These tags are used by the auto configuration feature. It matches the tags with the available profiles to automatically create dashboards and SLI/SLO’s that are defined in these matched profiles.
When dashboards and SLI/SLO’s are created automatically based on these tags, how does it know which metrics are relevant to the SUT? Each test run also comes with a test environment and SUT. Now the relevant metrics from this test environment can be shown and used in the dashboard templates in the profiles.
Are all SLI/SLO validations applicable to each type of test? No, certainly not. A stress test usually hits limits like high cpu usage or failing transactions. The workload defines which set of SLI’s are used for automatically validating the test result.
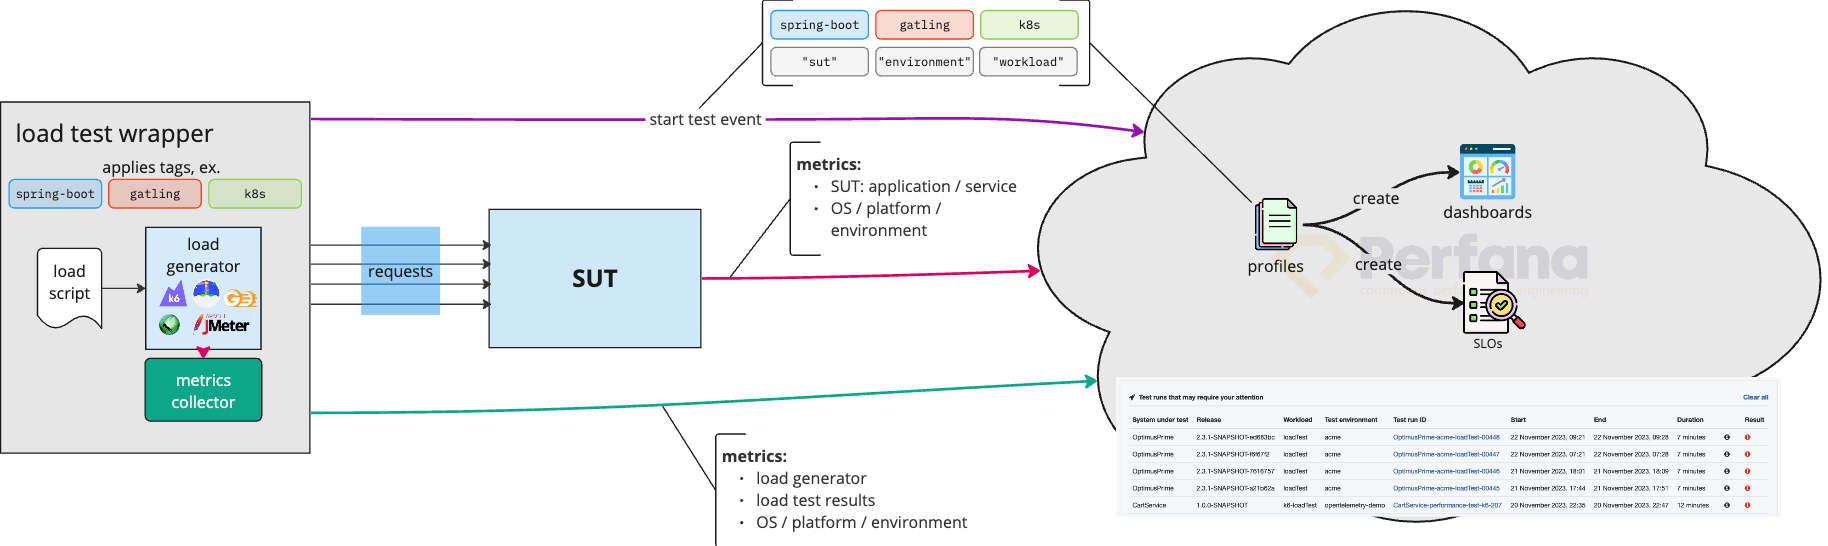
Last but not least, each test run has a start time and an end time. Perfana dashboards show the metrics for the duration of the test run. SLI/SLO validations optionally leave out ramp up time, which is what you expect and want most of the time, unless you have a stress test that is essentially one big ramp up.
The tags of the test run are specified via the test configuration. For most setups you can specify the tags in the Maven configuration that “wraps” the load script.
Snapshots and retention
A lot of metrics are collected all the time. To limit the amount of storage needed to keep all this data, most of the data is compressed over time and/or deleted. Sometimes even after just hours or days after a test run.
Perfana uses snapshots to keep hold of the uncompressed data of a test run. After each test run, snapshots are created and stored to be kept for several months. You can choose to store snapshots for designated test runs forever, for instance for a baseline runs you want to keep.
During the test run dashboards show the live data as it is being generated. After a test run the snapshot data is shown in a dashboard.
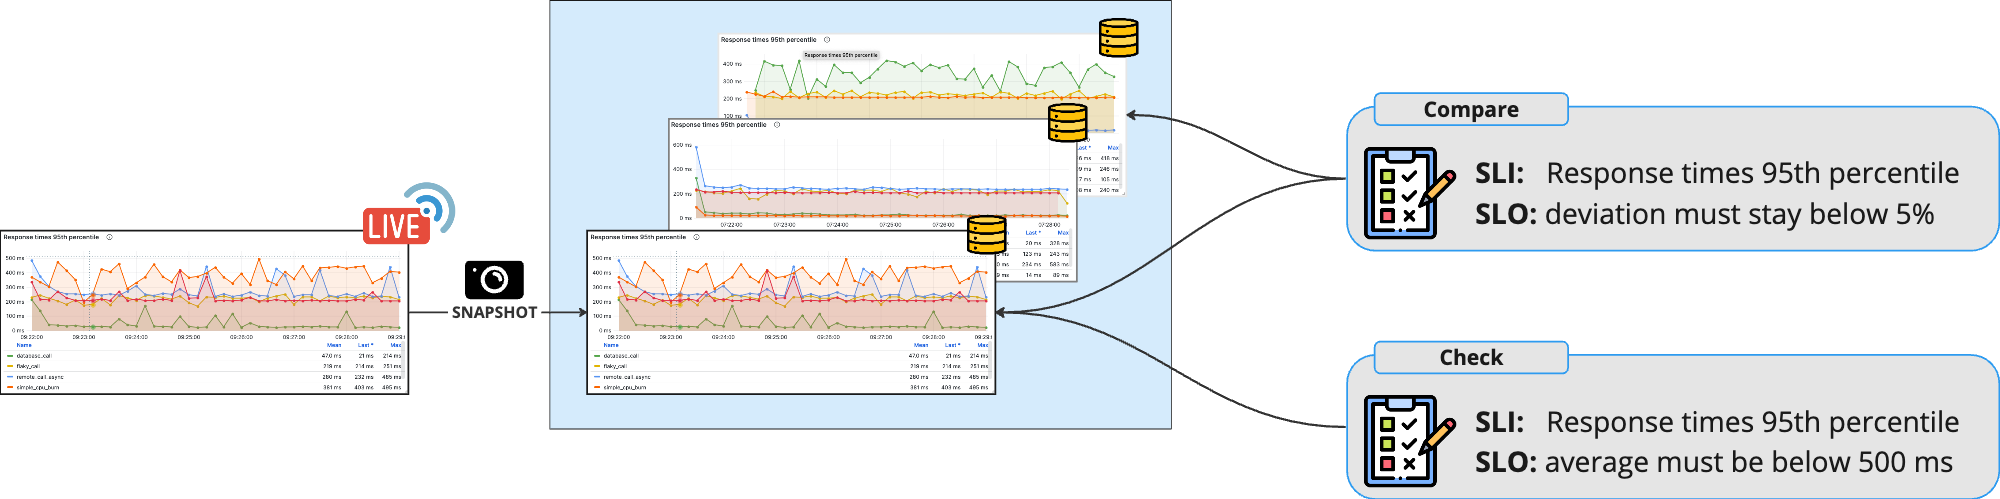
As soon as snapshots are created after the test run, the automatic analysis is done and the checks appear. There are check results and compare results. Check results are for the current test, for instance, the 90 percentile response time must be below 1 second. Compare results show and check the difference between the current test run and the previous test run, or a test run that is marked as baseline. An example of a compare requirement is: the 90 percentile response time must not be higher than 10 percent compared to the previous or baseline test run.