Analyze test runs
Table of contents
- Summary
- Comments
- Service Level Indicators
- Dashboards
- Configuration
- Reports
- Compare
- Jaeger
- Pyroscope
- Dynatrace (Enterprise feature)
- Jira (Enterprise feature)
- Manage
Summary
To get to the details of a test run click on a a test run ID from the Test Runs view.
The test run Summary tab has the following sections.
Test run information
The test run information sections shows all the meta data for the test. Click Add annotions link to add annotations to the test run. If required, you can click the Version, Start, End and Tags fields to change it manually.
Check results
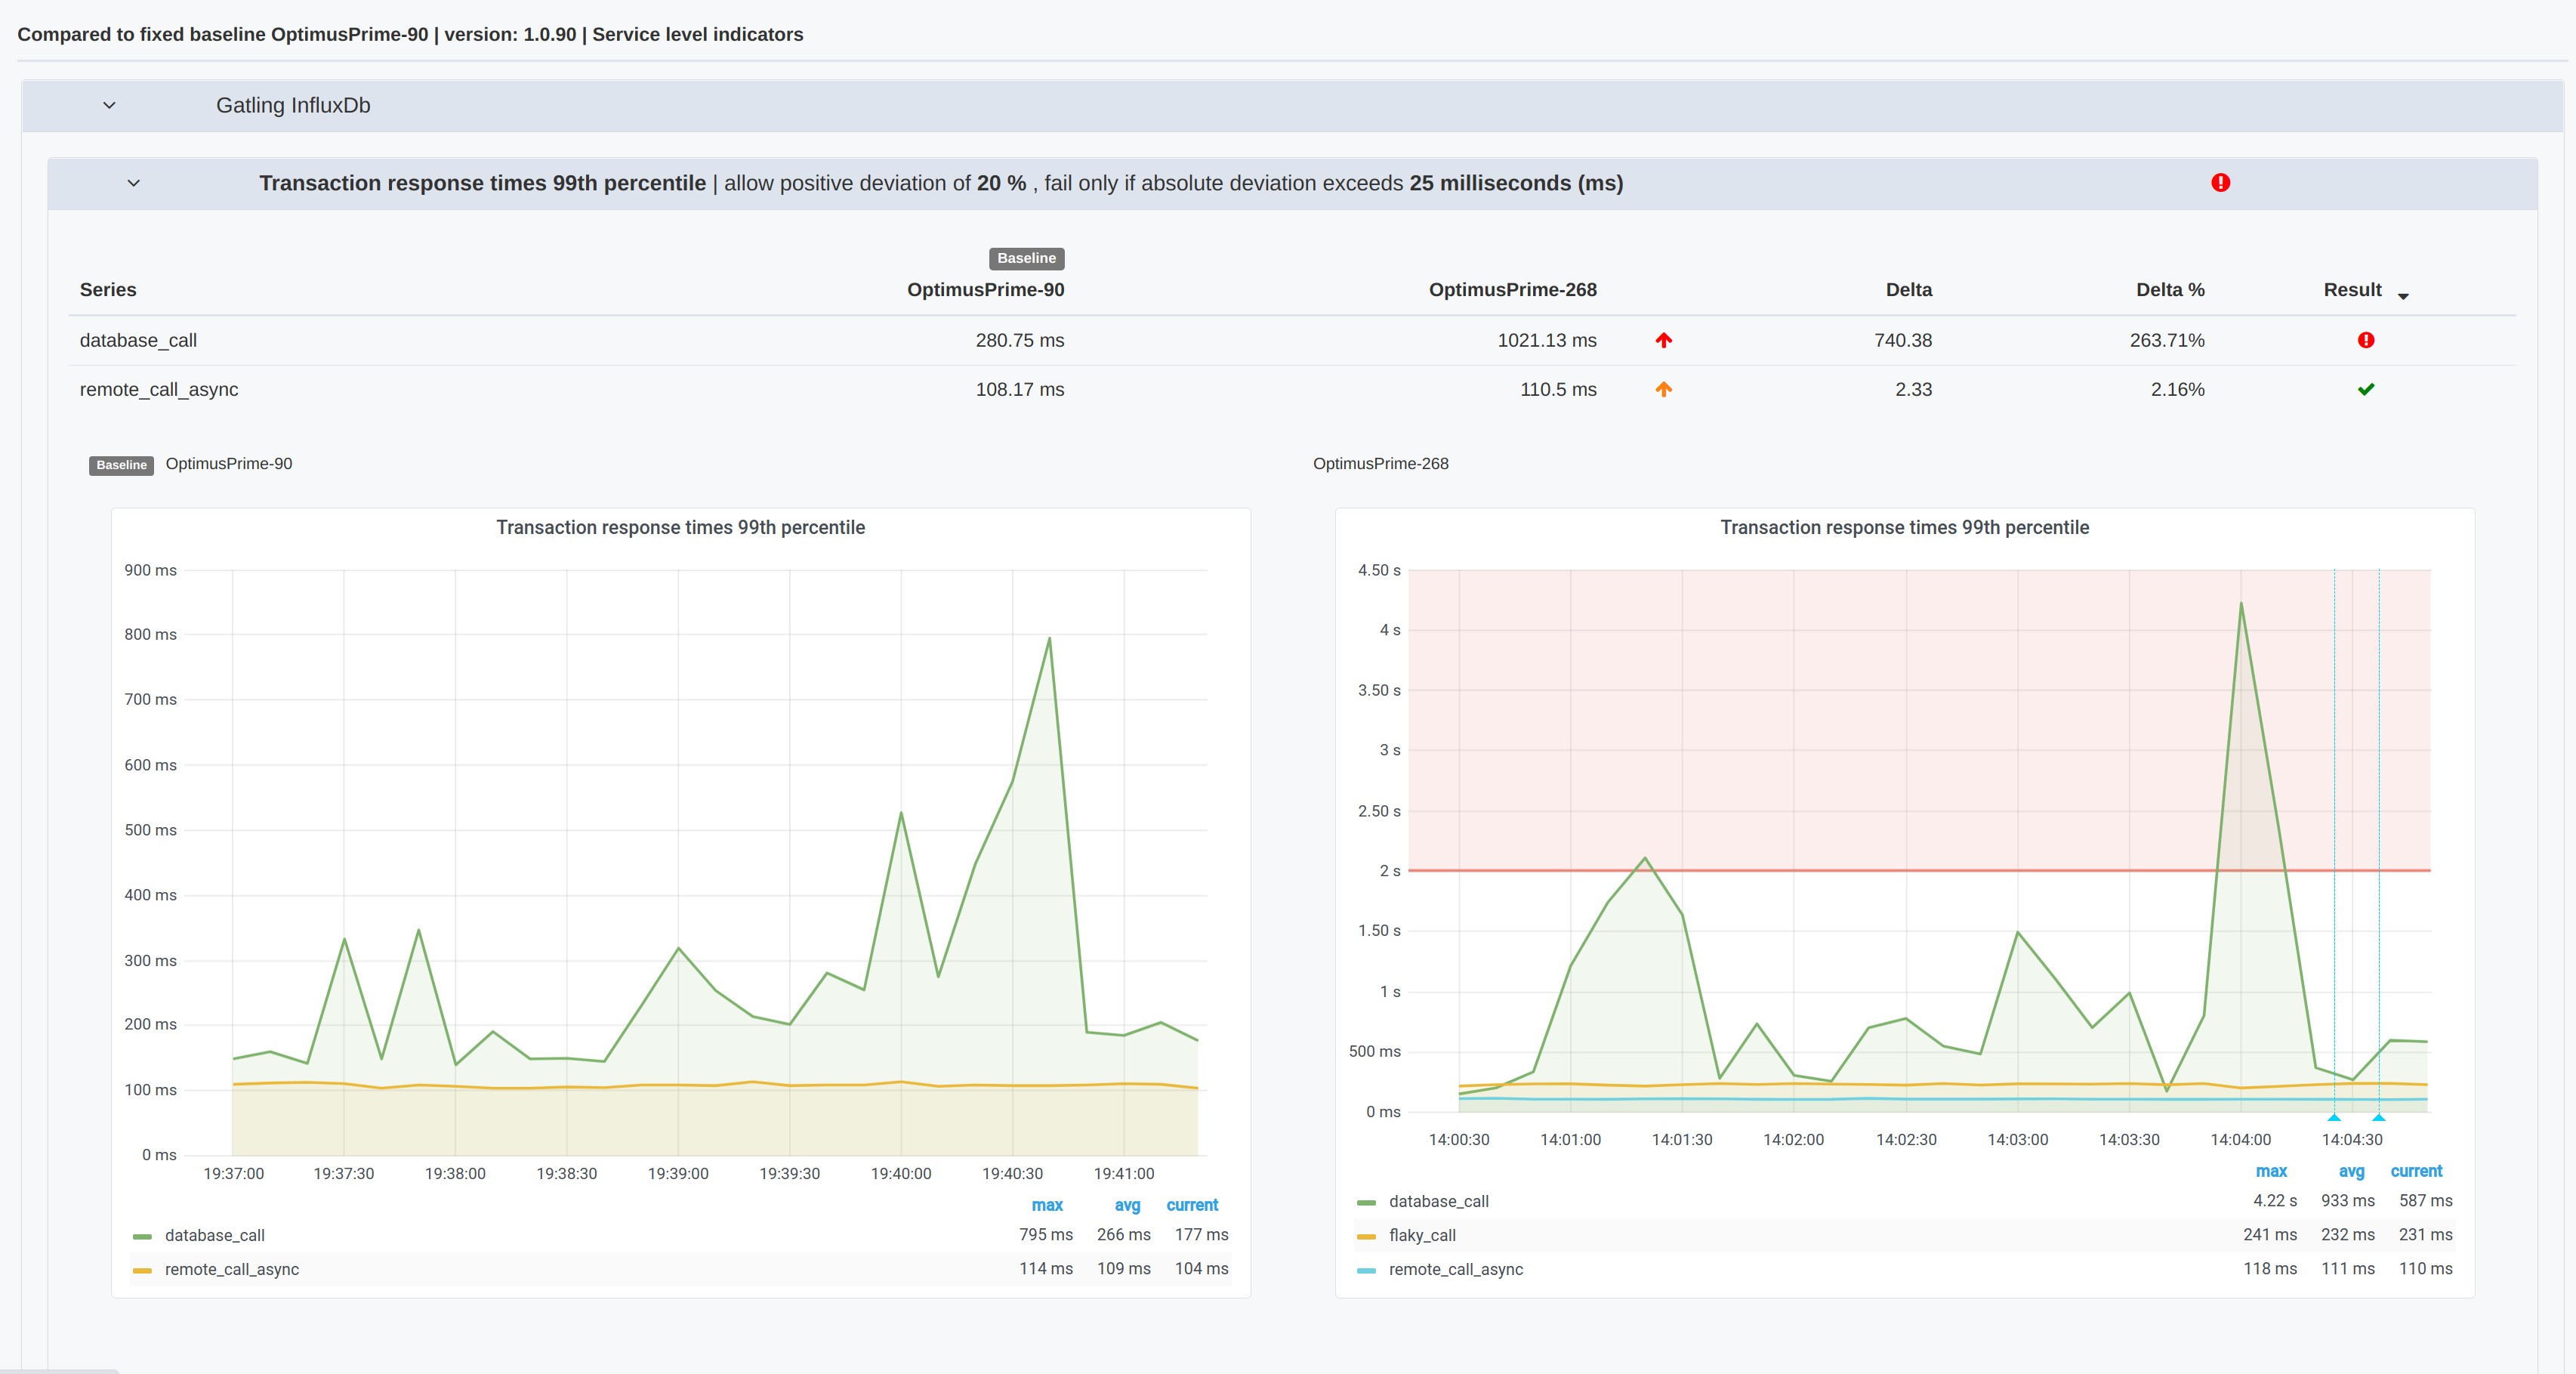
The Check results section shows the Service Level Objectives results and, if applicable, compare checks on the deltas for Service Level Indicators between this and the baseline test runs.
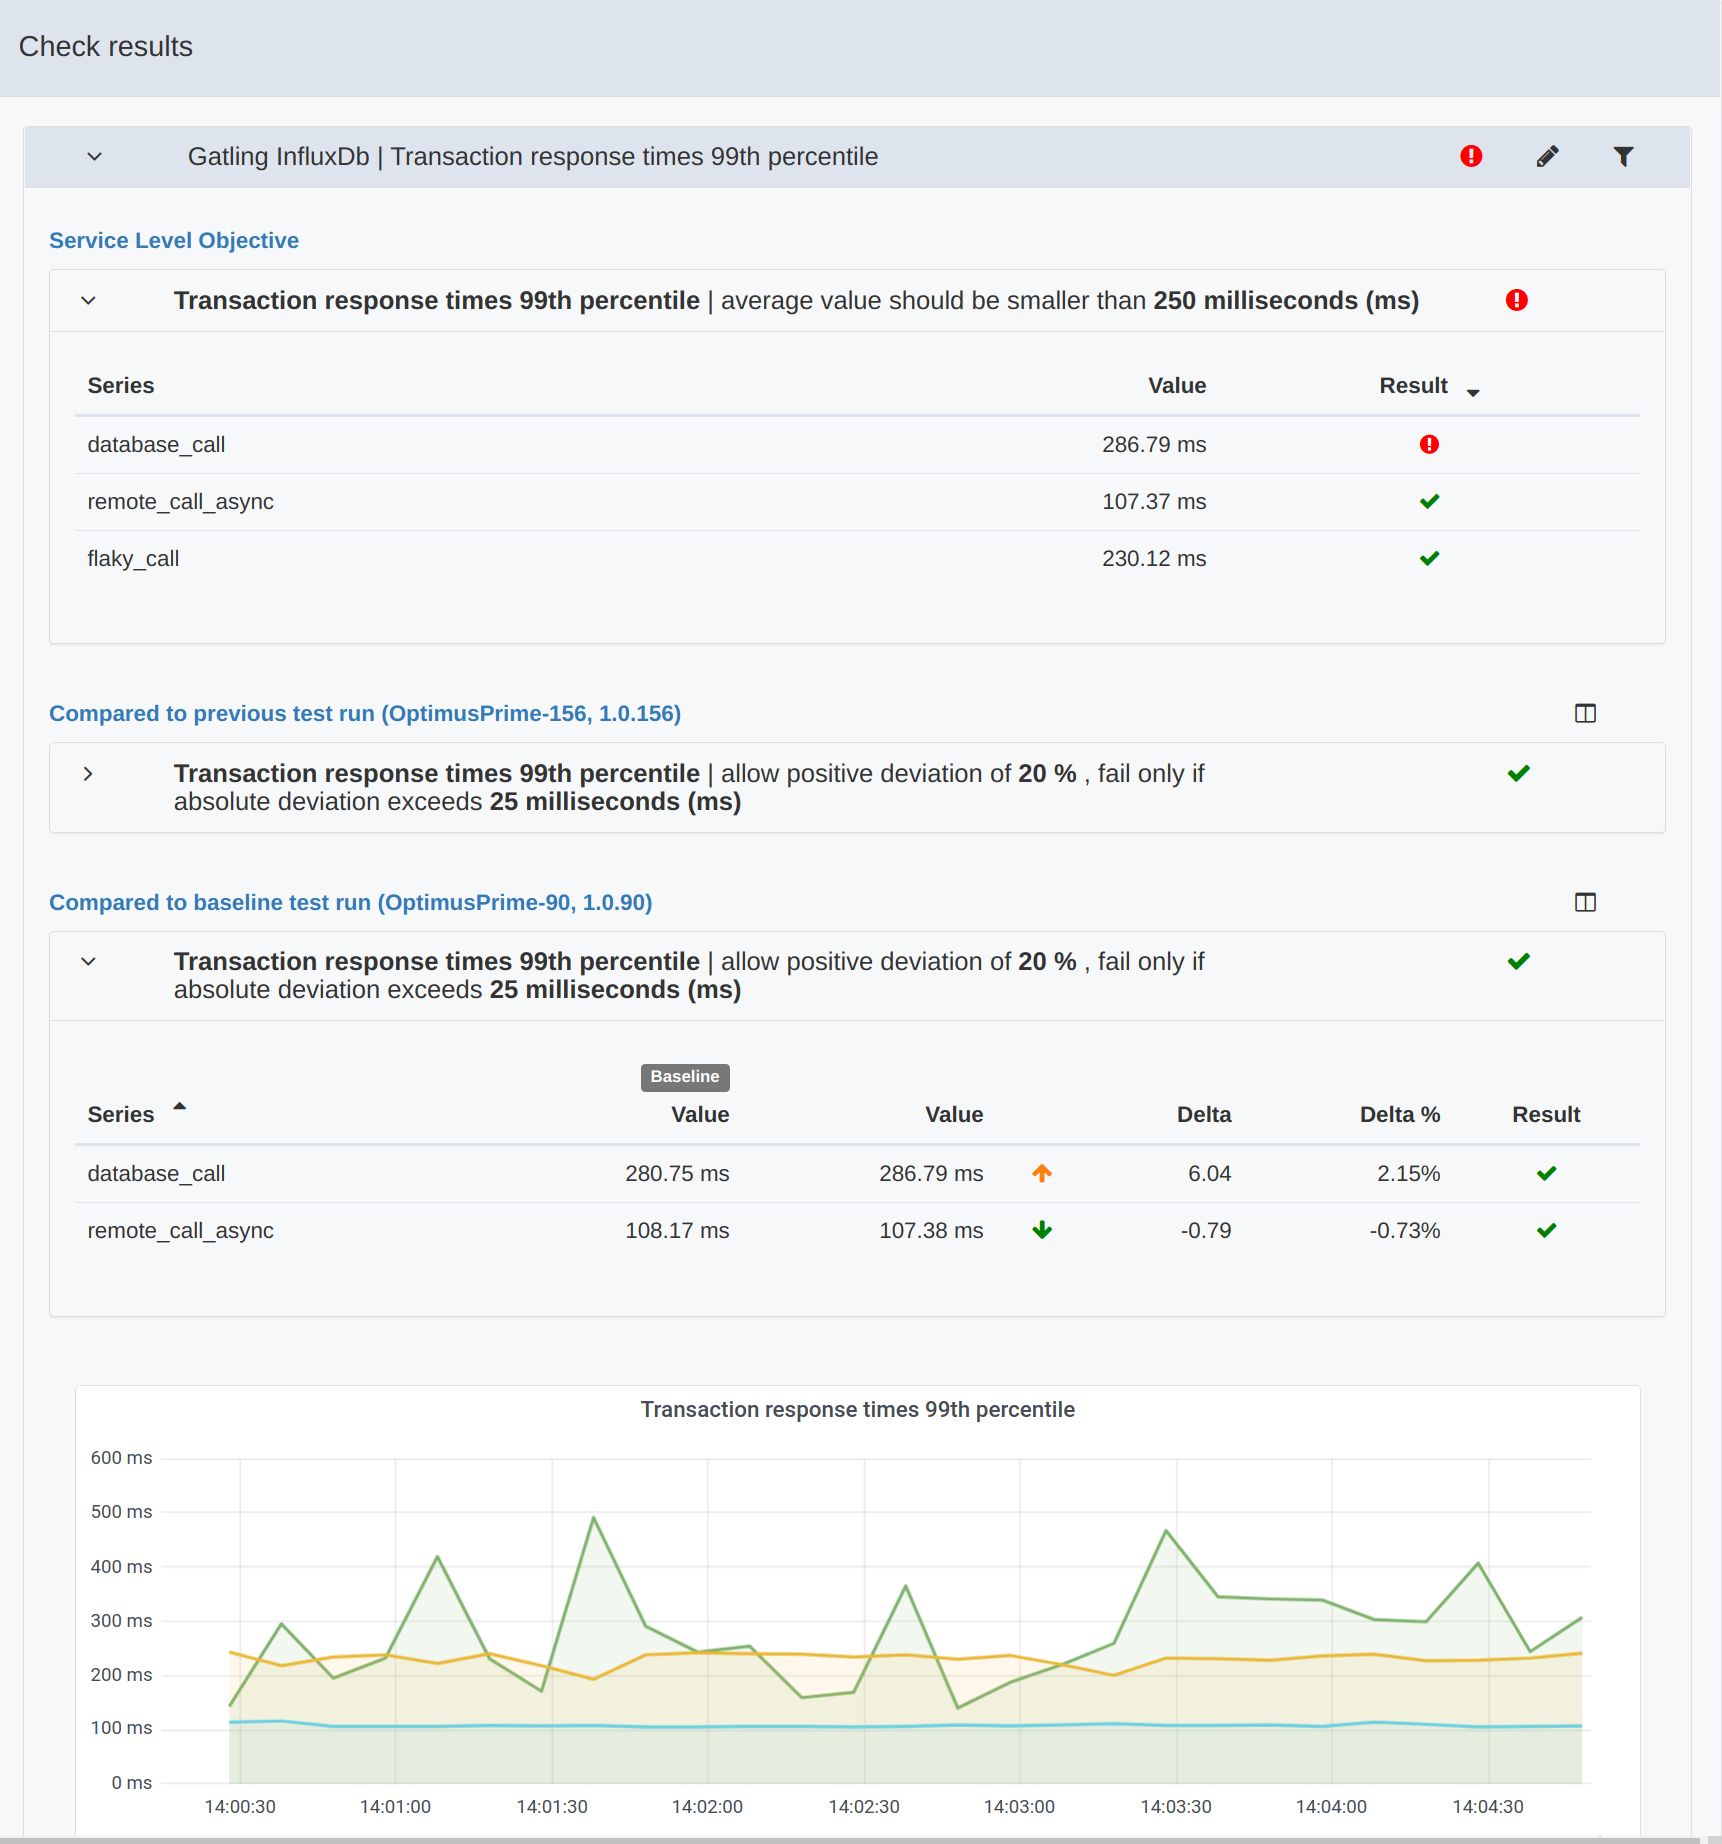
Click on a section to reveal more detailed information on the check results. See Service Level Indicators configuration
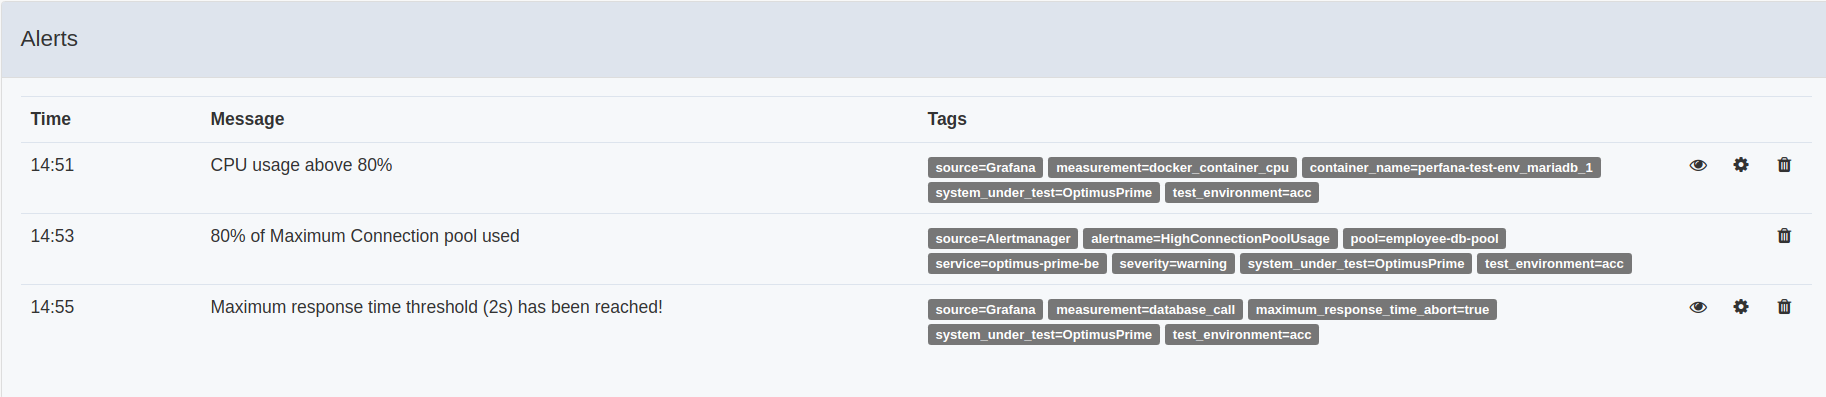
Alerts
If any alerts were triggered during the test they are displayed in this section. The alerts are also shown in graphs as vertical dotted lines. In case of alerts originating from Grafana you can view the metric that triggered the alert by clicking the eye icon. Click the settings icon to edit the alert configuration in Grafana.
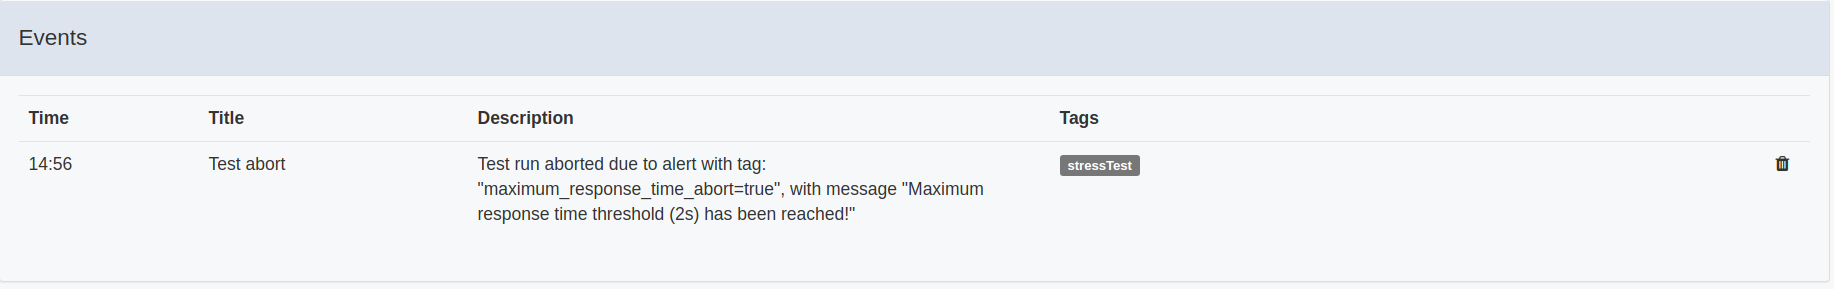
Events
If any events occured during the test (for instance triggered by using the events-scheduler plugin) they will be displayed in this section. The events are also shown in graphs as vertical dotted lines.
Links
This section shows the links defined for this test run (and are clickable!).
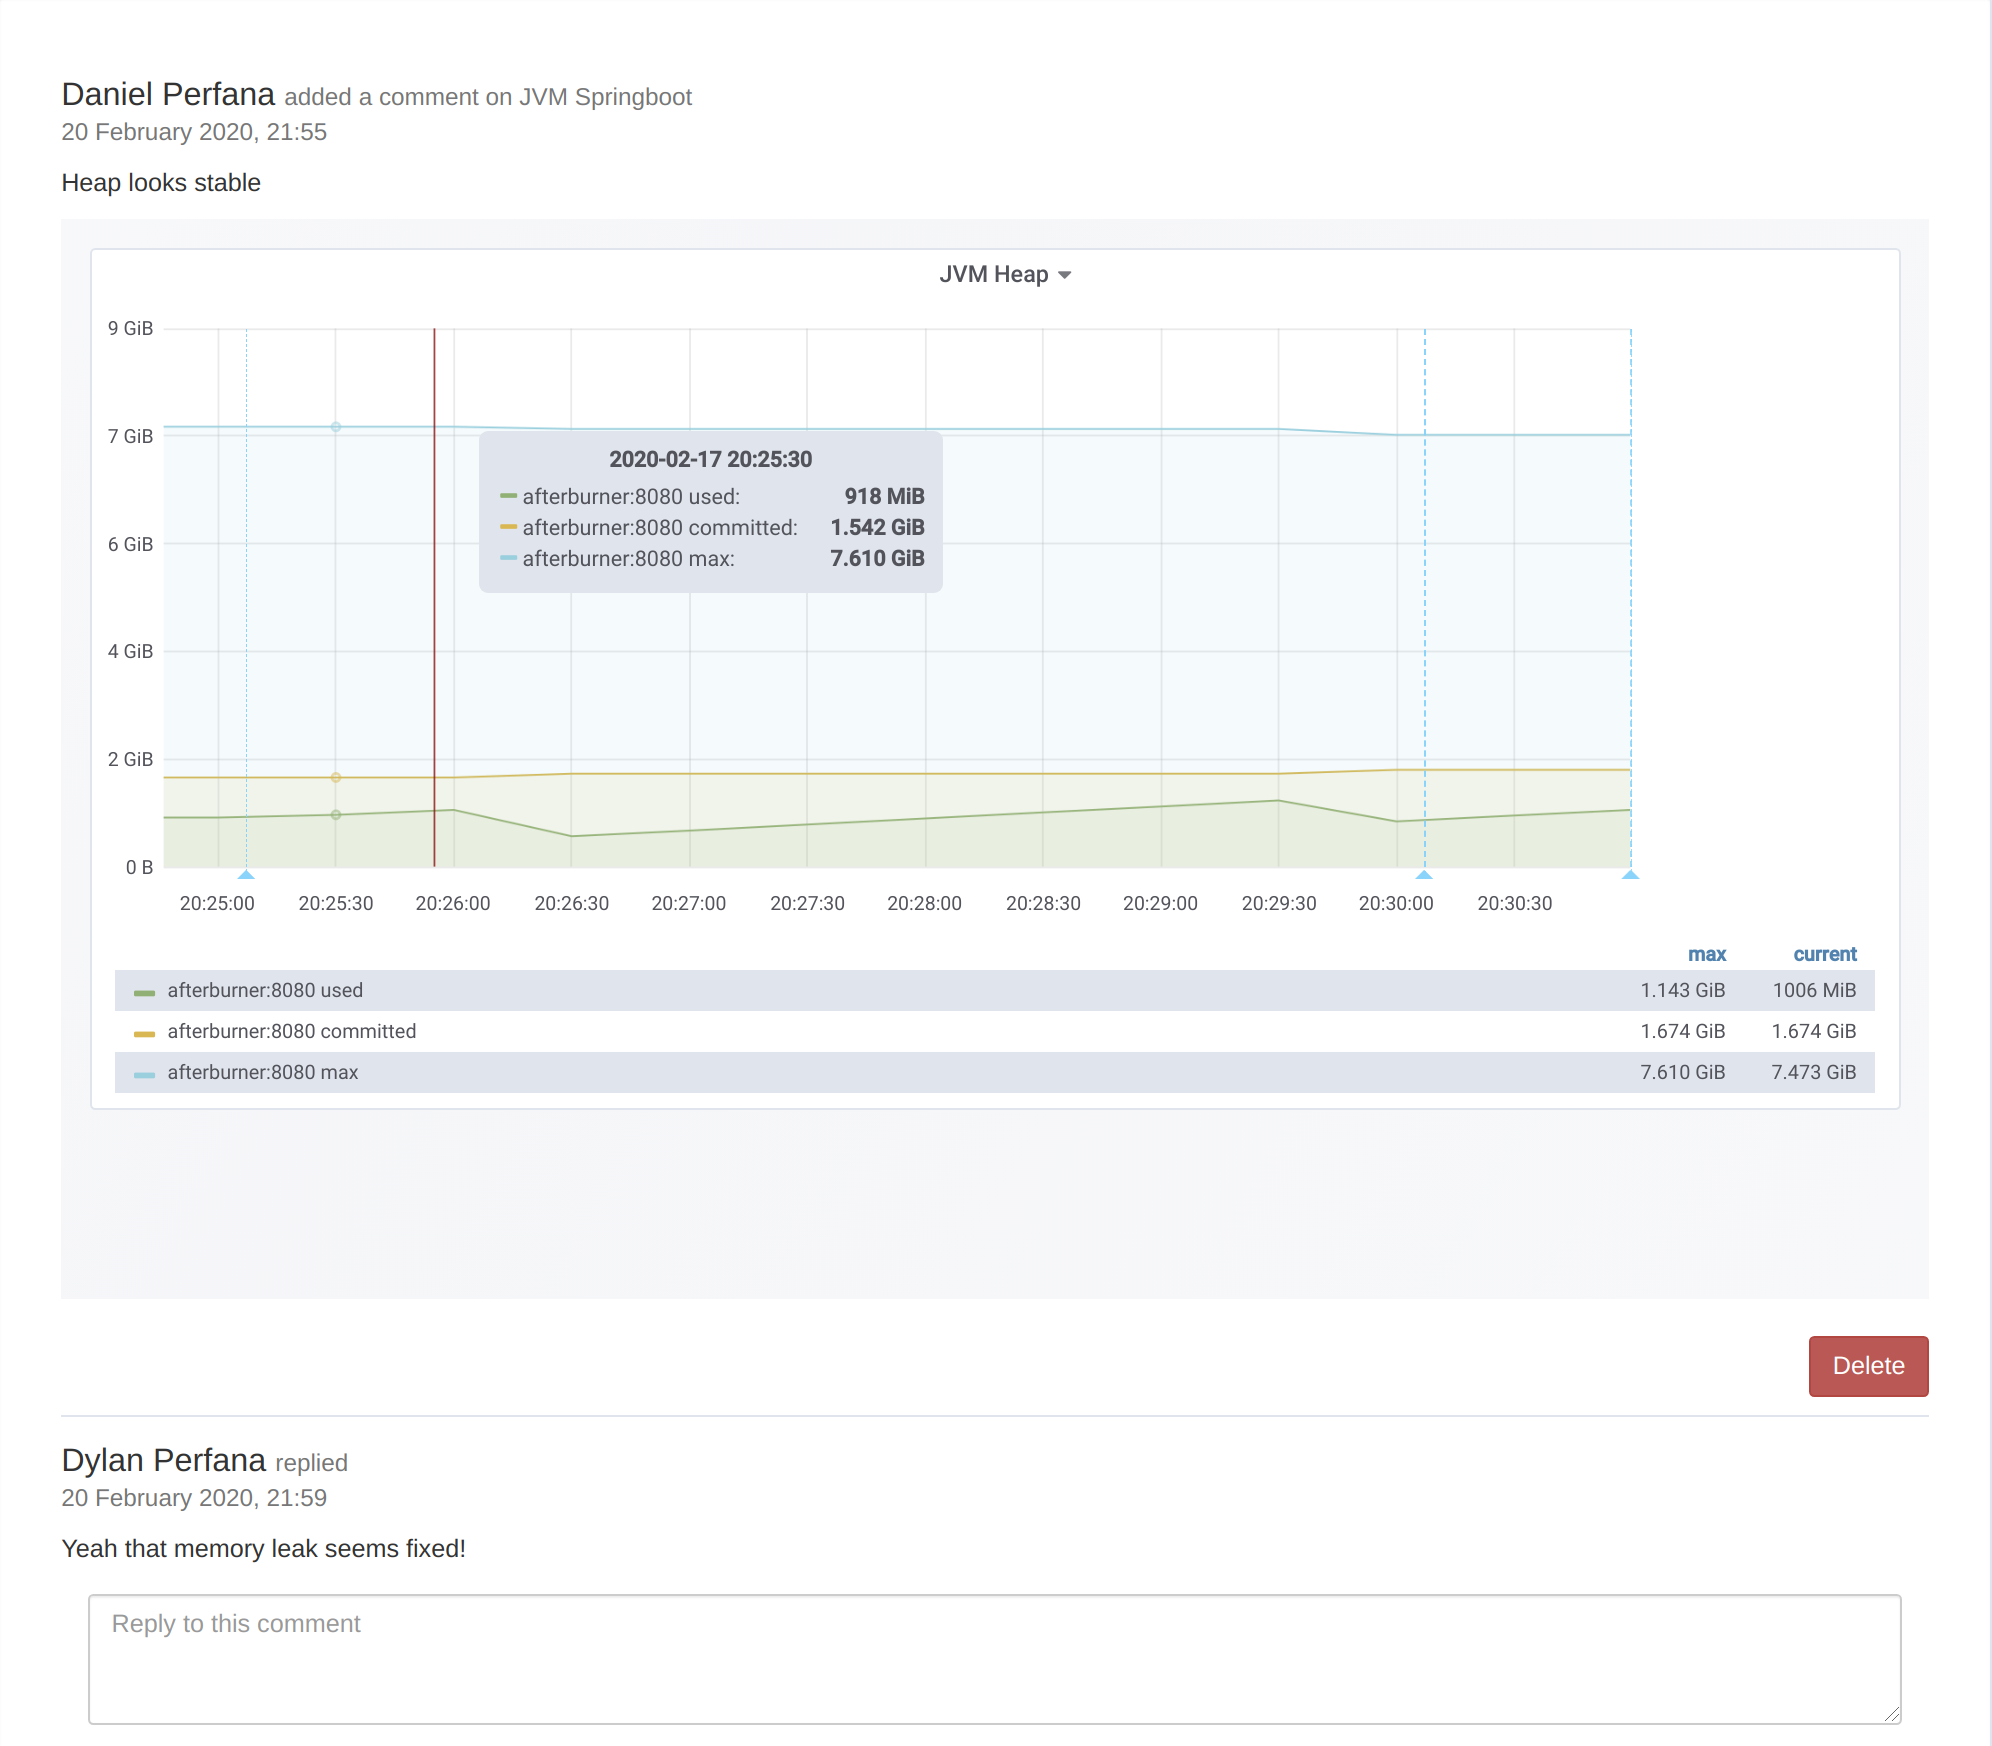
Comments
The comments tab displays comments on the test. Comments can be added to specific panels. Add comments from this view, the Service Level Indicators view or the Dashboards view. Use comments on graphs to share knowledge among team members and other users.
Add comments to a test run from these places:
- the
Commentstab: click theAdd commentbutton - the
Service Level Indicatorstab: click thecommenticon in the top right of the metric panels - the
Dashboardstab: click thecommenticon in the top right of the dashboard panels
The Add comment dialog has the following fields:
- Comment: Add your comment here. You can mention users by entering a
@and selecting the user from the drop down list. - Select notification channels: If one or more notification channels have been configured for the
system under testyou can can select them here. A notification of the comment is send to the selected channels. - Select dashboard: [Optional, depending on where “add comment” is clicked] Select dashboard to comment on.
- Select panel: [Optional, depending on where “add comment” is clicked] Select panel to comment on. The selected panel will be shown.
Service Level Indicators
This tab shows all Service Level Indicators graphs in one overview. See Service Level Indicators configuration.
Dashboards
This tab shows all Grafana dashboards linked to this test. The dashboards are organised in tabs based on dashboard tags. Click on the header rows to expand or collapse the dashboards. You can use the filter (accepts regular expressions) to display a subset of the dashboards.
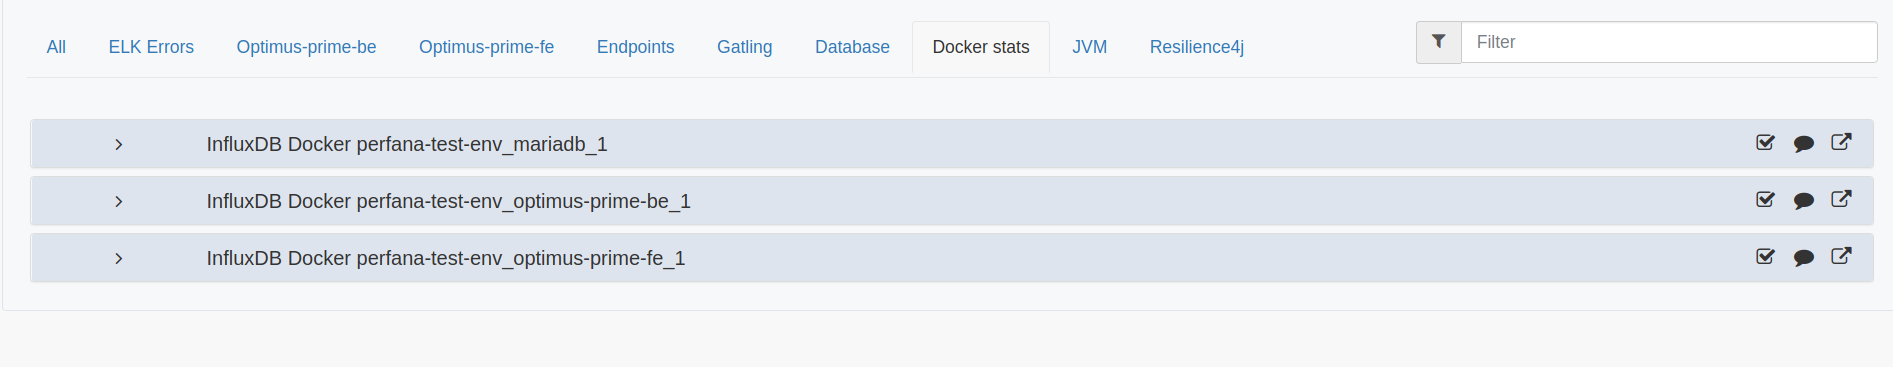
Based on the datasource retention times this tab shows either the dashboards with “live” data from the datasource or a snapshot of the dashboard.
Configuration
The Configuration tab shows configuration key-value pairs that have been added by the maven plugins to enrich the test run with configuration data of the system under test.
The first sub tab Configuration shows the configuration items for the test run. You can find items by filtering on keys or tags.
The Compared to previous test run by default shows diffs in configuration items between the current and previous test run. To view all items, uncheck the Show diffs only checkbox. The Compared to baseline test run and Compared to selected test run show similar data.
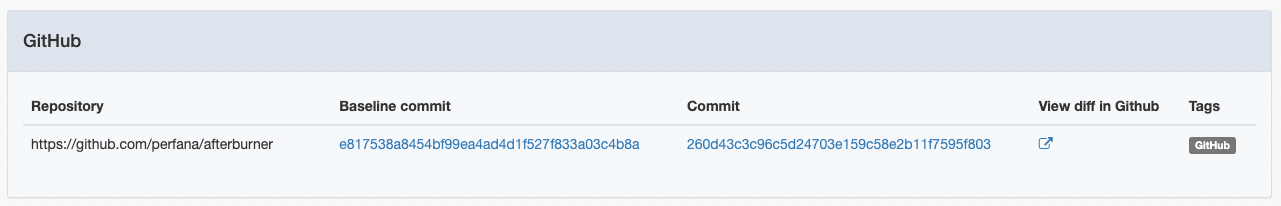
Key value pairs tagged with
Github, with a GitHub repository url as key and a git commit hash as value will be displayed in a separate panel, with a deeplink into Github to view code diffs.
<eventConfig implementation="io.perfana.events.testrunconfigcommand.TestRunConfigCommandEventConfig">
    <name>GitGetHash</name>
    <command>git rev-parse --verify HEAD</command>
    <output>key</output>
    <key>https://github.com/perfana/afterburner</key>
    <tags>GitHub</tags>
</eventConfig>
Reports
The Report tab is available when a reporting template is configured. The report contains a selection of relevant graphs with descriptions and can be used to share test results with stakeholders. The report is generated automatically based on the reporting template definition. Default descriptions can be added to the template and can be edited for each test run, if necessary. The report is available as long as the snapshots used in the report are not deleted. The banner on top of the report indicates how long the report will be available, based on the snapshot expiry setting If you want to keep the report click on the banner to persist snapshots used in the report indefinitely. When a report is persisted it will be available in the report explorer
It is also possible to add comparisons (see next paragraph) to one or more test runs to the report.
Compare
When multiple test runs exist with the same Test environment and Workload values, the Compare tab is shown. Use the compare feature to select another test run as baseline and compare all, or a selection of dashboards and metrics. The compare results are stored in the database for future reference.
To add a new comparison, click the Compare button. This will launch the Comparison wizard that will guide you through the configuration steps:
Select baseline test run
Select test run to use as baseline. This can be any test run, executed prior to or after the current test run.
Select comparison type
- Service Level Indicators only: Compare configured Service Level Indicators only and use comparison thresholds as specified.
- Custom: Select what dashboards and metrics to compare.
Settings
- Exclude ramp up time: Check to exclude the ramp up time when comparing the metrics.
- Average all metrics per panel: When comparing, metrics are matched on the series names. Sometimes the series names are dynamic and vary between test runs and cannot be mapped. In that case use this option as a workaround: the average over all series will be compared instead.
- Metric aggregation: Choose what aggregation to use when comparing the metrics.
- Evaluate comparison results: This option can be used to flag comparison results if they do need meet the specified condition.
Select dashboards
Select which Grafana dashboards to compare.
Select panels
Select per dashboard what panels to compare.
Save comparison results
Provide a description for the comparison result and click Compare
Jaeger
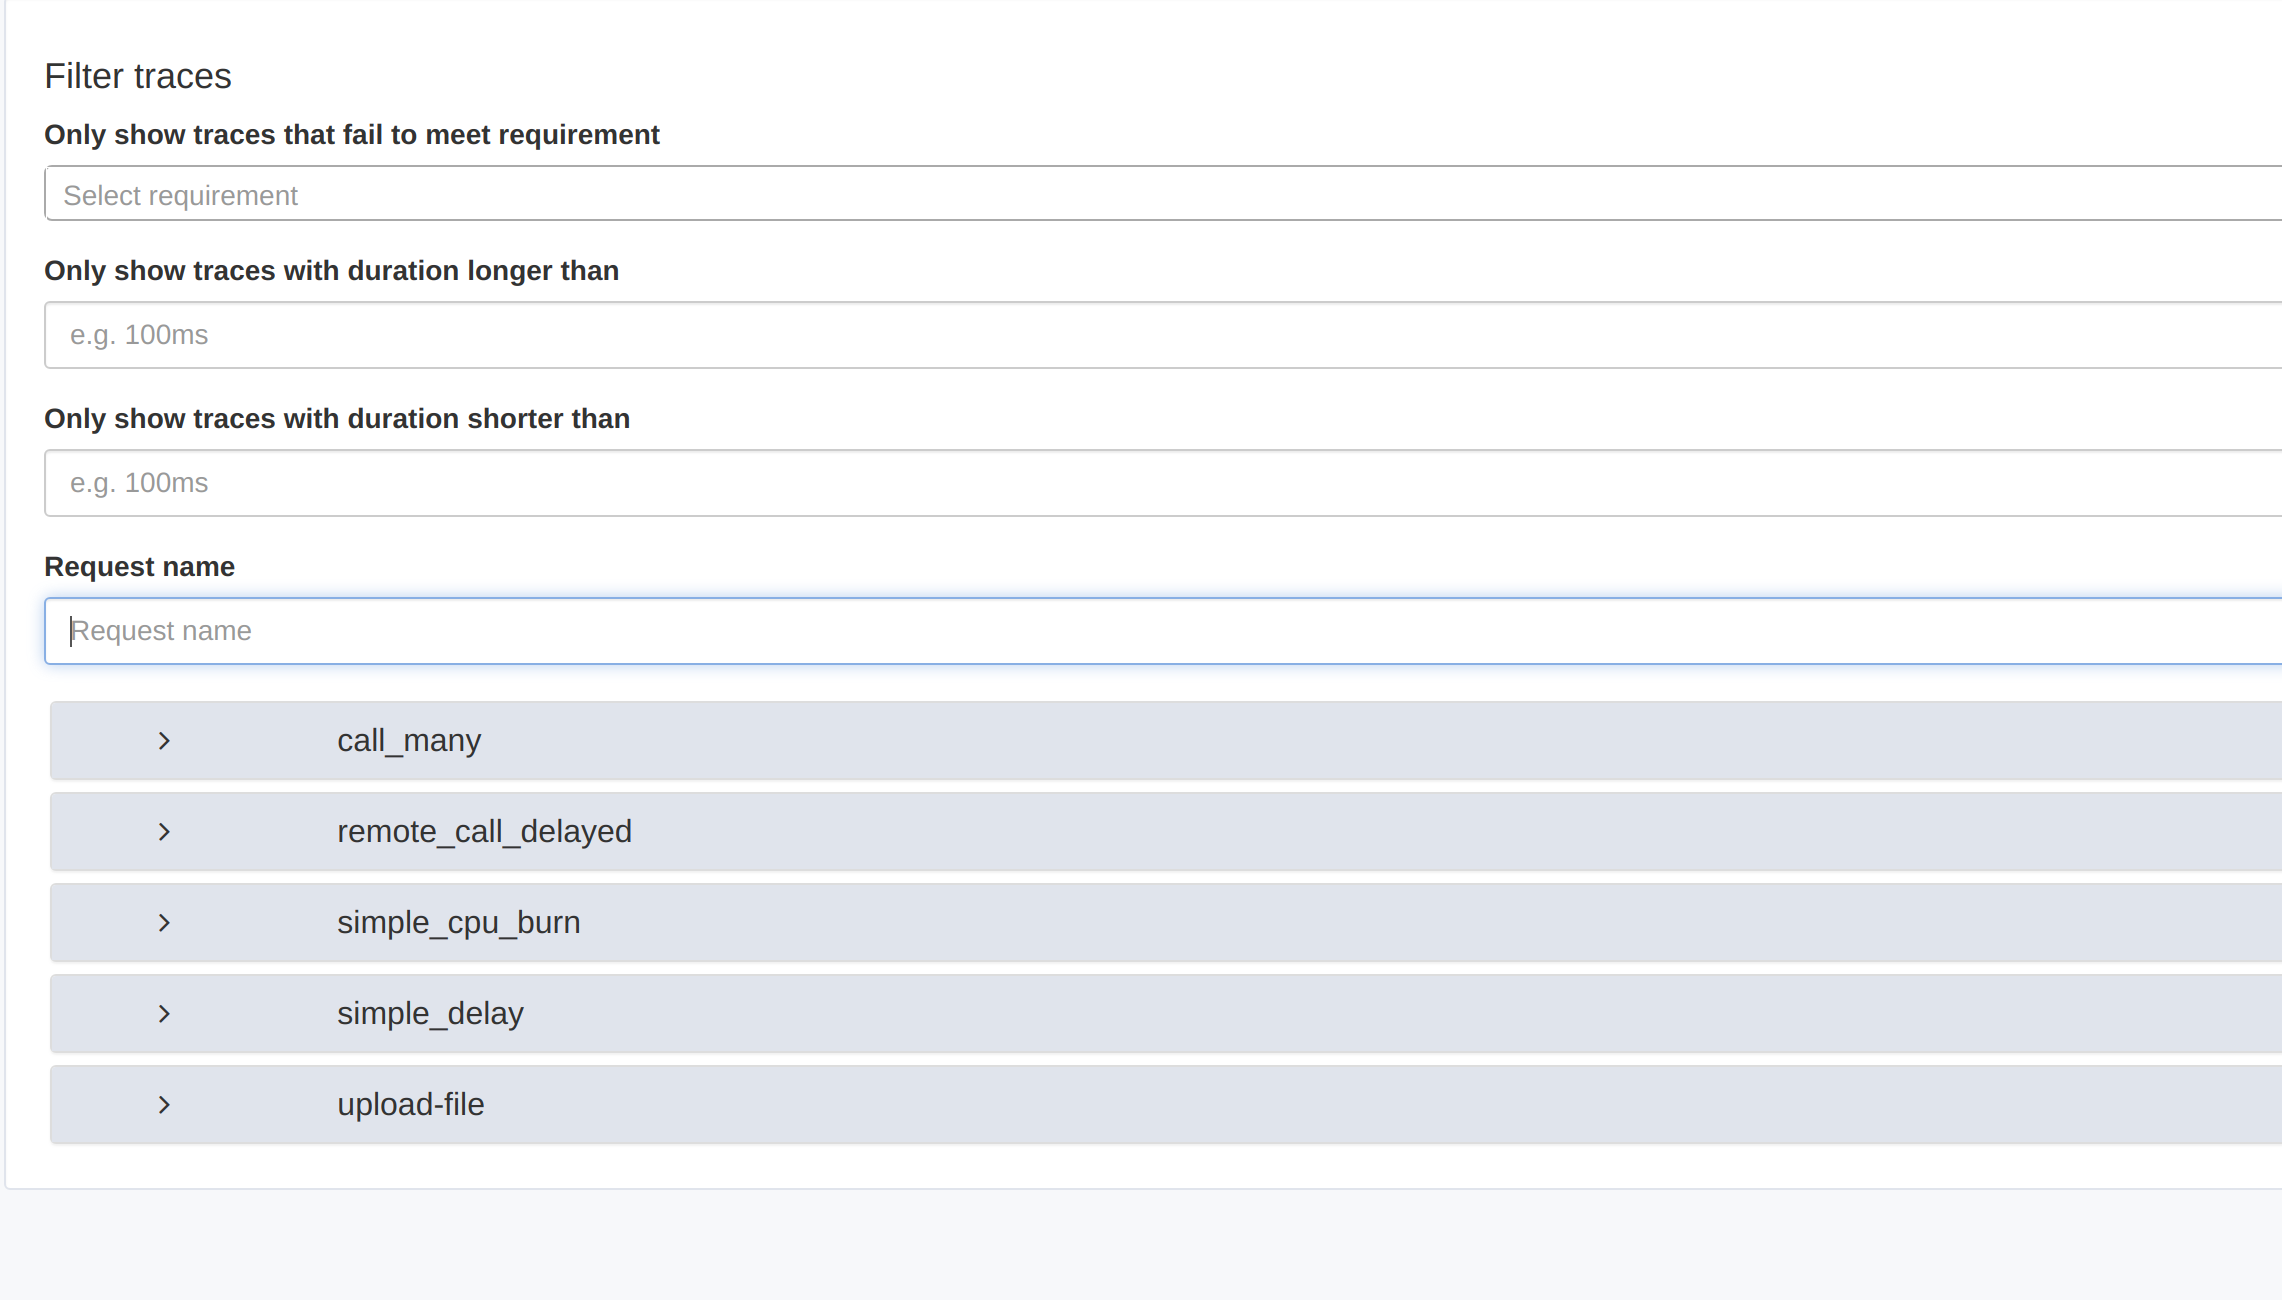
Perfana integrates with Jaeger to include distributed tracing information of your test run results. If tracing is set up, the Jaeger tab is visible. From this tab you can deeplink into the Jaeger UI using a number of filters:
To configure what entrypoint to use, go to the system under test settings
- Only show traces that fail to meet Service Level Objective: If a Service Level Objective has been specified for response times metrics, the requirement values can be used to filter traces.
- Only show traces with duration longer than: Filters on minimum duration of the traces.
- Only show traces with duration shorter than: Filters on maximum duration of the traces.
- Request name: Filter on request name.
To deeplink into the Jaeger UI based on the filters, click on the request names.
Pyroscope
Perfana integrates with Pyroscope to view profiling flamegraphs of your system under test.
To configure the Pyroscope application name to use, go to the system under test settings
The Pyroscopetab has three sub-tabs:
- Single view: shows a Pyroscope flamegraph for the current test run
- Compare view: shows the Pyroscope flamegraph compare view. Use the
Baseline test rundropdown to select a test run to compare with. - Diff view: shows the Pyroscope flamegraph diff view. Use the
Baseline test rundropdown to select a test run to diff with.
Dynatrace (Enterprise feature)
Perfana integrates with Dynatrace to include tracing information in your test run results. If a Dynatrace integration is set up, the Dynatrace tab is visible.
The Dynatrace view has the following sections:
Dynatrace entitiy
Use the dropdown to select one of the configured Dynatrace entities for the system under test.
Problems
The problem section shows “Problems” detected by the Dynatrace AI that impacted the selected Dynatrace entity during the test.
Request filter
In this section you can set these request filters:
- Only show traces that fail to meet Service Level Objective: If a Service Level Objective has been specified for response times metrics, the requirement values can be used to filter traces.
- Only show traces with duration longer than: Filter on minimum duration of the traces
- Only show traces with duration shorter than: Filter on maximum duration of the traces
- Request name: Filter on request name.
Multidimensional analysis
This section has deeplinks, based on the selected Dynatrace entity and request filters, into the multidimensional analysis view in Dynatrace
Deeplinks
This section has deeplinks, based on the selected Dynatrace entity and request filters, into miscellaneous views in Dynatrace that might help you analyse your test run results.
Compare
In the compare section you can select another test run as baseline and use the Dynatrace compare feature to compare several metrics for the test run.
Jira (Enterprise feature)
Perfana integrates with Jira to create issues direcly from Perfana and link them to a test run.
If the Jira integration is set up, the Jira tab is visible.
Create issue
Click the Create issue button to bring up the Create Jira issue form. The form shows the “required” fields (as configured) for the selected project and issue type.
If any comments have been made for the test run, you can include them in the Jira Issue.
If the user that is logged in Perfana does not exist in Jira, there will be a reporter dropdown to pick a reporter for the issue. These reporters can be specified in the Jira configuration
Link issue
If there are issues already created and linked to other test runs for the system under test a Link to existing issue button appears that will start the Add as comment to exisitng issue dialog. Use this dialog to link the test run results as comment to an existing Jira issue.
Manage
The Manage tab is only available for users with a team-member role for the team reponsible for the system under test and admin users. It has the following sections for managing the test run:
- Test run status: displays the status for the different stages the test run goes through after it has finished. It also displays the expiry date for the test run. Read more on test run expiry here.
- Manage Grafana snapshots: create, delete, update and view Grafana snapshots for the test run. To prevent snapshots from being deleted after the retention period, use
Set to never expireusing thediskicon. Note: if a report is generated for the test run (by opening theReporttab), the snapshots are automatically saved. - Manage test run: This section has a button to
Delete test runor to set it asfixed baseline.Adminusers are also allowed to edit the test run properties. - Manage checks: Contains a button to manually re-evaluate the configured checks, for example after having changed the check requirements.
- Manage Report: Here you can delete the saved report.
- Debug test run: Download a zip with all related resources for offline debugging of issues.