Alerts
Table of contents
Perfana integrates with a number of tools that emit alerts based on rules. If an integrated alerting tool triggers an alert, Perfana tries to map alert tags to properties of a running test. If it finds a match, it creates an annotation for all linked Grafana dashboards in each graph for that test run. This helps you to track down root causes for bottlenecks in your test.
Alertmanager
To integrate Alertmanager alerts with Perfana, Perfana has to be set up as a Prometheus receiver.
receivers:
- name: default-receiver
  webhook_configs:
  - url: 'http://<perfana_host>/prometheus-alerts'
    send_resolved: false
Next, create one ore more alerting rules like the ones in prometheus.rules.yml.
Grafana alerts
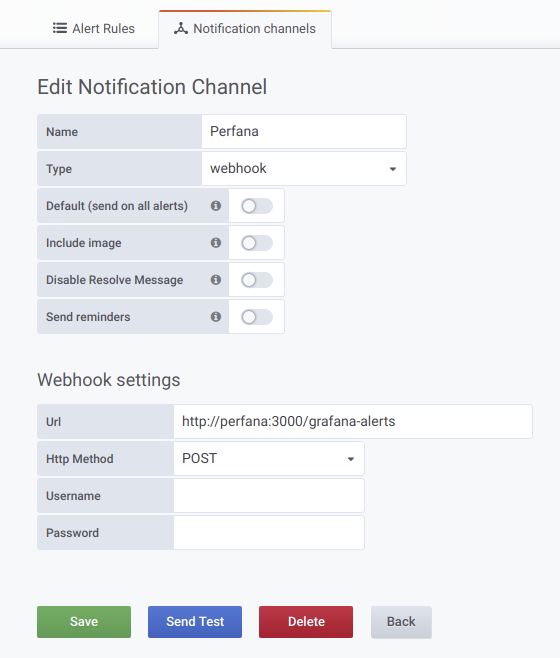
You can also create alerts in Grafana. To integrate these alerts with Perfana create a notifications channel in Grafana.
The channel type should be webhook, the url http://<perfana-host>/grafana-alerts and the httpMethod POST
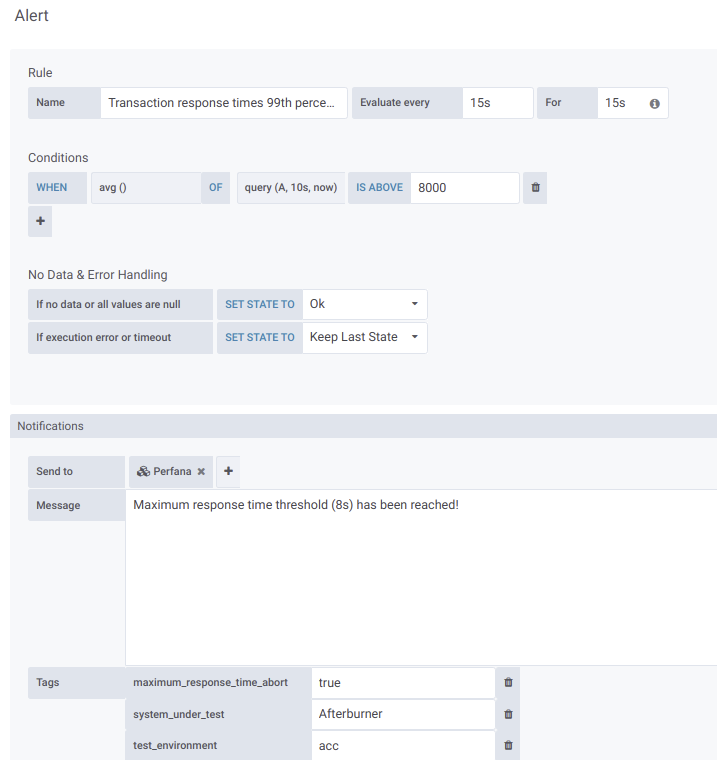
Then create an alert on a panel in one of your dashboards. To do so, choose edit from the panel menu and find the Alert section.
Set the following properties:
No Data & Error Handling:
- If no data or all values are null SET STATE TO
Ok - If execution error or timeout SET STATE TO
Keep Last State
Make sure interval used in the query
query(A, 10s, now)is larger than the write interval for the metric, to prevent the alerting engine to set state toOkunintentionally whennullvalues are returned!
Notications:
- Send to: Select the
Perfananotification channel you have created earlier. - Message: Add a descriptive message, this will be displayed in Perfana.
- Tags:
- system_under_test: Required should match the
system_under_testfor your test - test_environment: Required should match the
test_environmentfor your test - test run abort tag: Optional See tag to use to abort a test run. In the example screenshot below this is
maximum_response_time_abort.
- system_under_test: Required should match the