Navigating test runs
Table of contents
Landing page
After logging in the user is redirected to his or her personal landig page. It contains deeplinks to the Test runs view with preset filters on either the team(s) of the user or the systems under test that those teams are responsible for.
The Test runs that may require your attention section shows test runs with failed checks not yet visited by the user.
In the top right of the screens there are notifications for the user that are created on several events, like test runs with failed checks and new comments on test runs.
Test runs
Click the rocket icon in the sidebar to open the Test runs view.
Test run selector
Use the Test run selector to filter test runs on System under test, Test environment and Workload. Switch to Team mode to filter on Team.
Running tests
The Running tests section shows any currenty running tests matching the filters in the Test run selector. A running test can be stopped by clicking the abort icon next to the progress bar
Click the Test run ID to open the running test view. This view has two tabs:
- Service Level Indicators: shows the configured Service Level Indicators for this test. See Service Level Indicators configuration
- Dashboards: shows the configured dashboards for this test. See Grafana dashboards configuration
- Configuration: shows the configuration items for this running test and comaprisons with previous tests. See Configuration
- Jaeger: shows the Jaeger UI for this running test. See Jaeger
- Pyroscope: shows the Pyroscope UI for this running test. See Pyroscope
- Links: shows the configuration items for this test. See Links
- Dynatrace (Enterprise feature): shows the Dynatrace view for this running test. See Dynatrace
Recent runs
The Recent runs section shows finished test runs matching the filters in the Test run selector. The runs are sorted on date, the most recent on top.
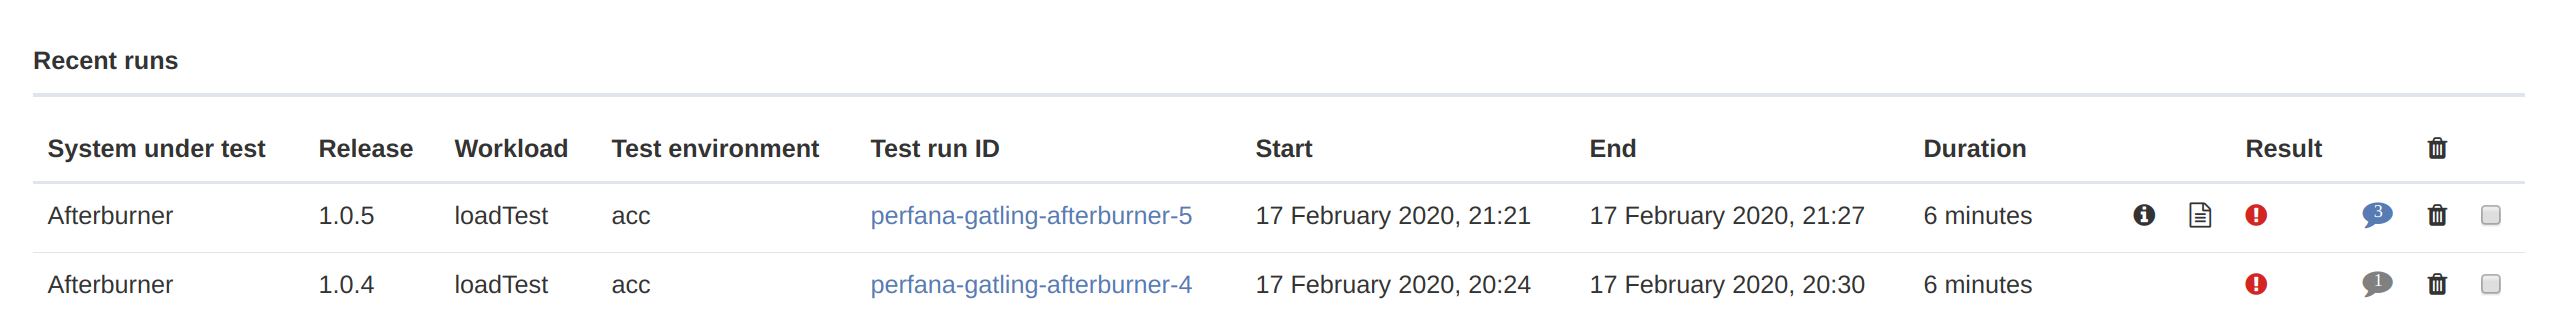
The table has a number of columns:
- Test run meta data like
System under test,Version,Workload,Test environment,Test run ID,Start,EndandDuration - The
infoicon is displayed when annotations are added to the test run. Hover over the icon to see the annotations. - The
reporticon is shown when a report has been created. Click the icon to see the report. - The
resultcolumn displays the (consolidated) result, but only when checks are created for the test runs. - The
commentsicon shows the number of comments, if comments exist. The icon is blue when there are unread comments. - A
trashcanicon shows when the user is allowed to delete test runs for the system under test. Delete multiple test runs at once using the checkboxes and by clicking the trashcan in the table header.
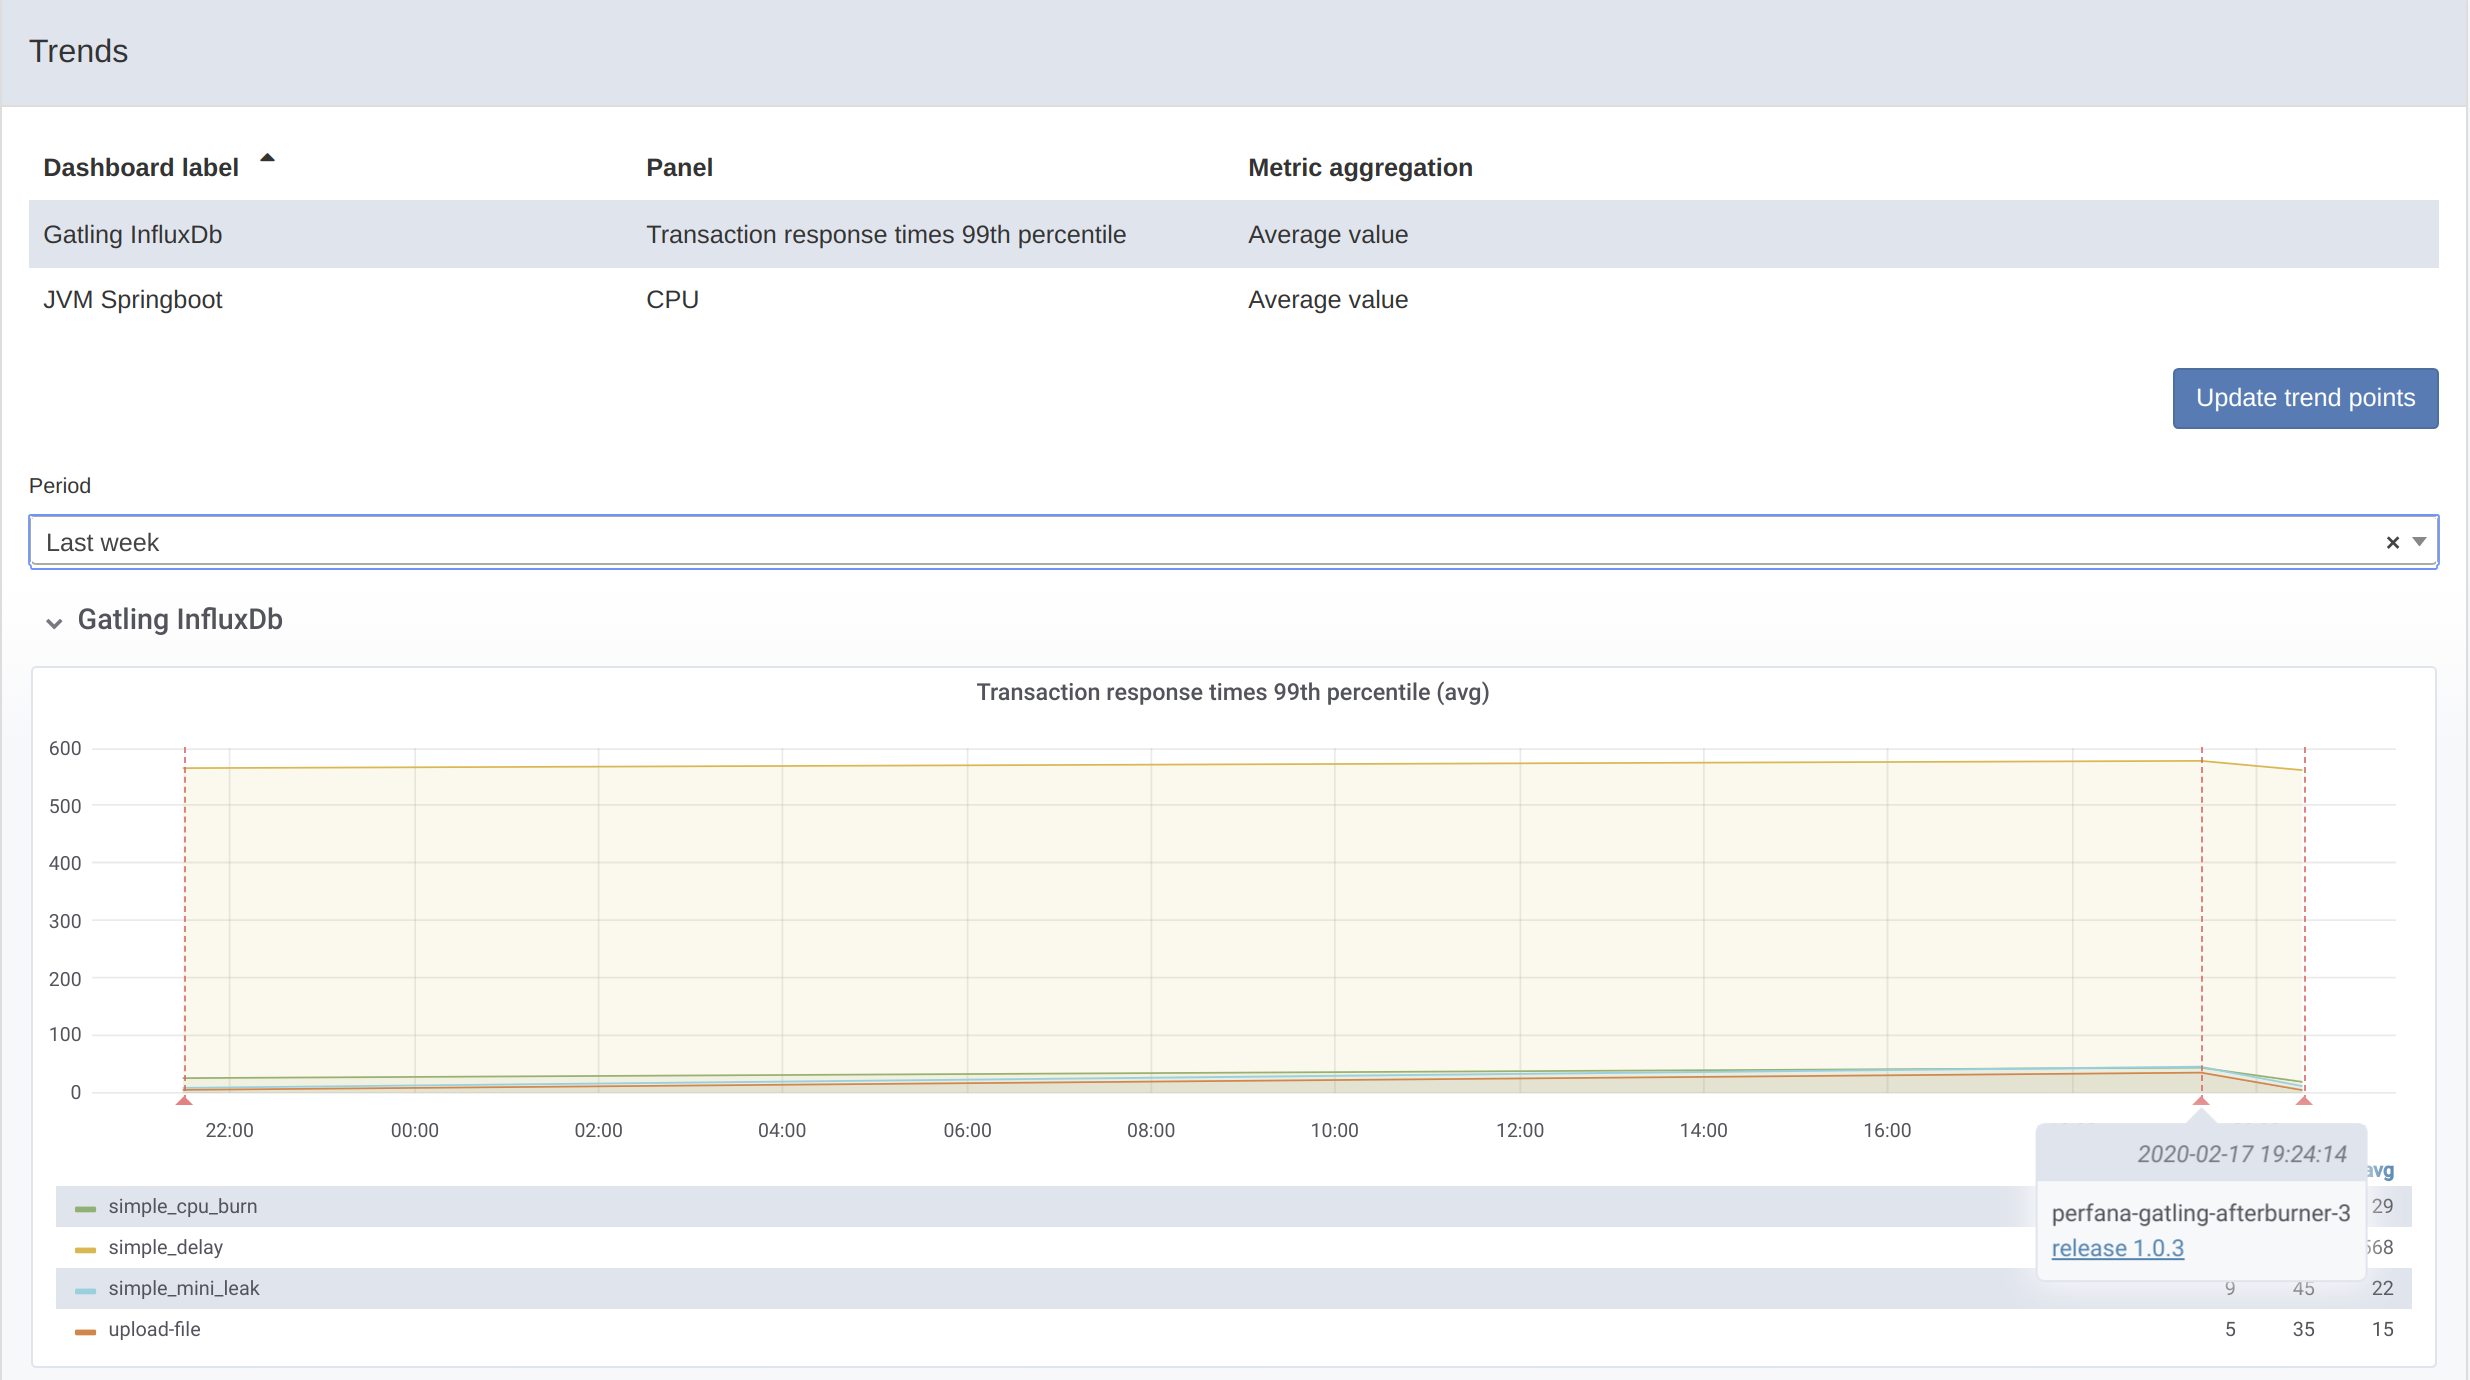
Trends
The Trends tab in the Test runs page appears when multiple test runs are available with the same Test environment and Workload properties. There are trends for the defined Service Level Indicators. Select a period and each test run in that time frame is marked as a vertical line. Hover over the base of the line to see the test run id and the version. Click on version number link in the hover to go directly to the test run details. You can use the tag filter to only display test runs with a specific tag.
Reports
If a report for a test run is persisted it will be available in the Reports explorer that can be opened by clicking the REPORTS item in the sidebar.
You can use the System under test, Test environment, workload and Tags filters to find reports.